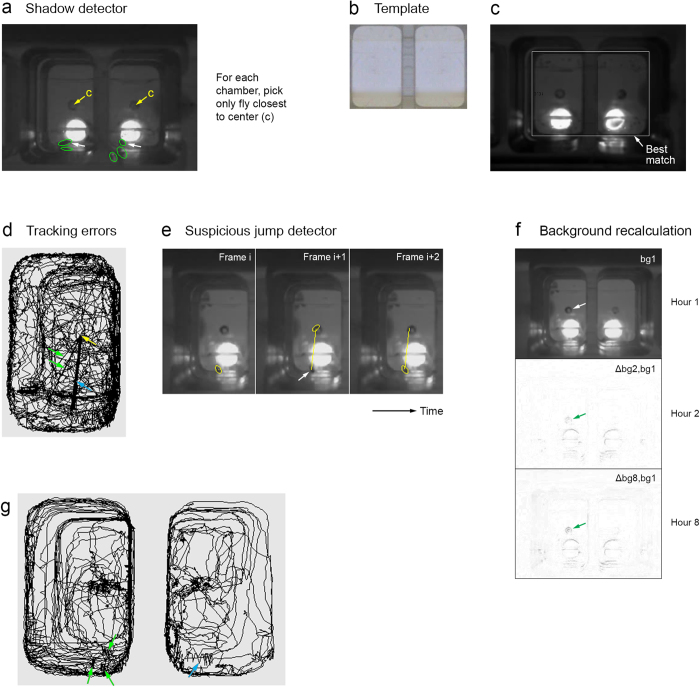
Figure 2. Techniques used for our “UV on” experiments.
(a) Sample frame (same as Fig. 1g) illustrating shadow detector, which (correctly) picks the flies pointed to by white arrows. See text for details. (b-c) Template matching. See text for details. (b) Template image (showing bottom of chambers in good lighting conditions). (c) Background image with white rectangle indicating where the template best matches the background. (d-e) Detecting tracking errors. (d) 1-hour trajectory with tracking error. The blue and green arrows point to multiple jumps (straight lines) to or from the center of the chamber (yellow arrow), with the blue arrow pointing to multiple almost identical jumps. (e) Sample jump reported by our suspicious jump detector. The image shows three consecutive partial (left chamber only) frames (i, i + 1, i + 2), with the ellipses showing where Ctrax reports the fly is and the arrow pointing to the fly’s actual position in the error frame (i + 1). (f) Background recalculation for an 8 h “UV on” video. The background calculated over the 1st hour is shown at the top of the panel (bg1). Differences between bg1 and the backgrounds calculated over the 2nd and 8th hours (Δbg2, bg1 and Δbg8, bg1) are shown below bg1. Some of the background changes here (arrows) are caused by changes in grape juice level in the center well. (g) Typical 1-hour trajectories of two (not-too-active) flies using Ctrax with extensions on an 8h “UV on” video with strong shadows. Arrows point to shorter incorrect jumps (easiest to see for blue arrow).

