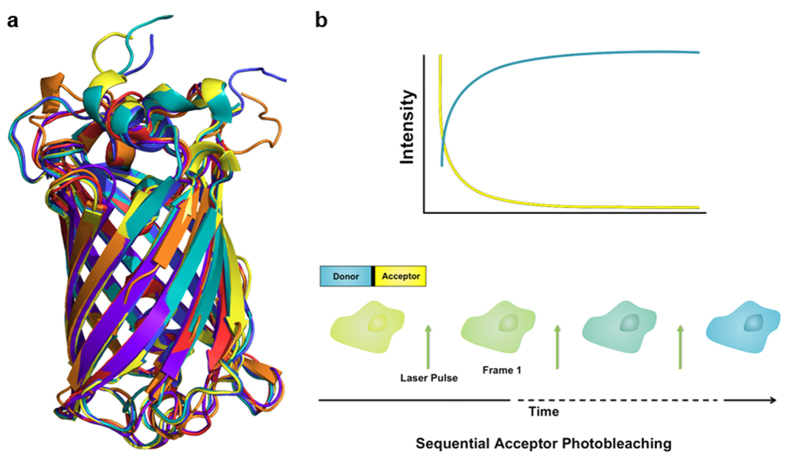
Figure 1. Fluorescent protein structural homology and general experimental approach.
a. The pdb files for mCherry (red), TagRFP (orange) Citrine (yellow), CyPet (cyan), mTFP1 (purple), and Tq2 (blue) were aligned to mCherry and displayed in PyMOL, the RMSD values range from 0.49 – 1.09 Å. The high sequence and tertiary structure homology of the FPs provides evidence that the chromophores will be at a very similar distance in all constructs with a common linker allowing for direct comparison based on the experimental FRET efficiencies. b. The FRET efficiency is determined for a linked construct following acceptor photobleaching. As the acceptor is bleached, the donor is dequenched, and the change in donor fluorescence is used to calculate the FRET efficiency. Images are also collected in the acceptor channel to ensure complete photobleaching occurs.

