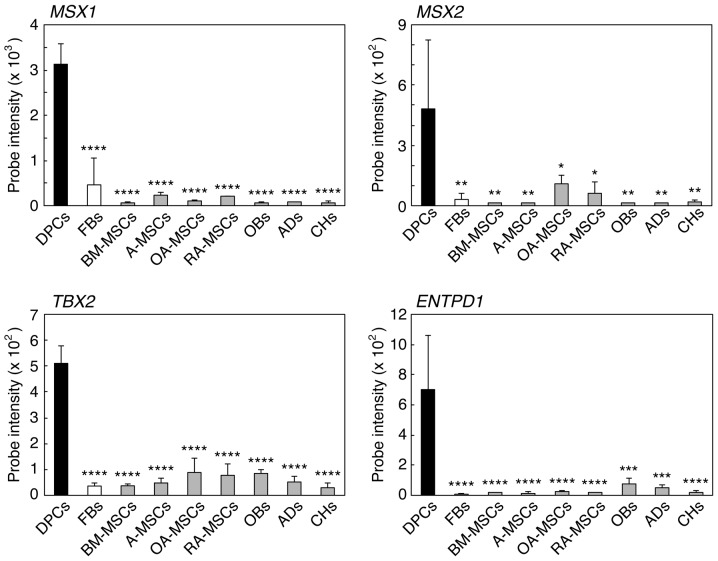
Figure 1.
Comparison of the expression levels of the dental pulp cell (DPC)-characteristic genes in various types of cells by DNA microarray analyses. Total RNA was extracted from DPCs-(cultures 2–4), fibroblasts (FBs)-(1–3), bone marrow-derived mesenchymal stem cells (BM-MSCs)-(1–3), adipose tissue-derived MSCs (A-MSCs)-(1–3), osteoarthritis arthritis synovium-derived MSCs (OA-MSCs)-(1–3), rheumatoid arthritis synovium-derived MSCs (RA-MSCs)-(1–3), osteoblasts (OBs), adipocytes (ADs) and chondrocytes (CHs). Gene expression levels of the four genes [msh homeobox 1 (MSX1), msh homeobox 2 (MSX2), T-box 2 (TBX2) and ectonucleoside triphosphate diphosphohydrolase 1 (ENTPD1)] were estimated by measuring the probe intensity in the microarray analyses. The values expressed are mean ± standard deviation for three cultures. *P<0.05, **P<0.01, ***P<0.005, ****P<0.001 vs. DPCs.

