Figure 2.
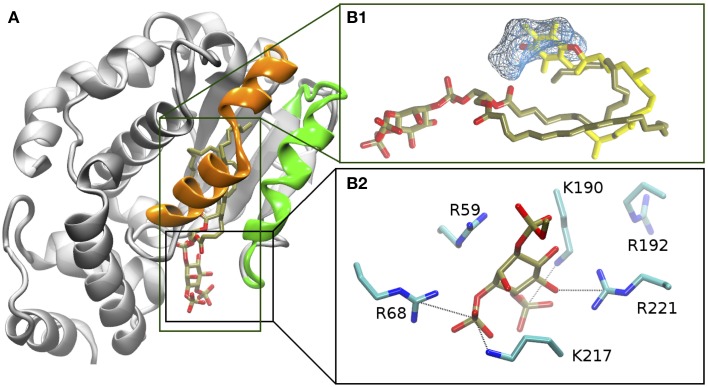
Protein ligand Interactions in the α-TTP-PI(3,4)P2 complex from MD. (A) Structure of the relaxed complex. The mobile gate and interacting region are evidenced in green and orange, respectively. (B1) comparison of the orientation of the fatty acid tails of PI(3,4)P2 after relaxation (tan licorice) with the position of α-Tol (yellow licorice) in the binding cavity from PDB: 1R5L (Meier et al., 2003). The cyan wireframe represents the area of the cavity that in our MD simulations remains occupied by water, and which corresponds to the location of the hydrophilic moiety of α-Tol. (B2) position of the phosphorylated head of PI(3,4)P2 (in tan and red licorice) and surrounding basic amio acids (in cyan and blue licorice).

