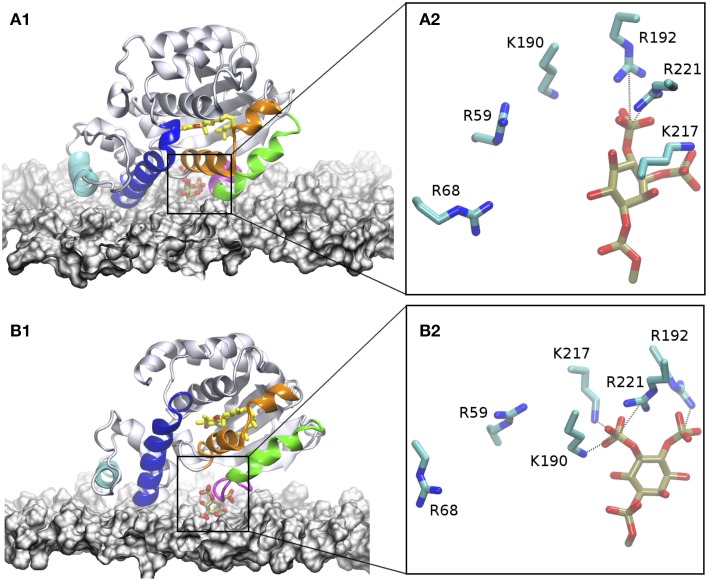
Figure 6.
Interaction of α-TTP with the plasma membrane. In the figures, the membrane surface is represented by a white surface. The two N-terminal helices that interact with the membrane are highlighted in cyan and blue, the mobile gate in green, and neighboring motif in organge. the loop/short-helix motif at the C-terminal part of the mobile gate which provides both contacts to PIP2 and to the membrane is colored in purple. The α-Tol molecule bound to the protein is depicted in yellow licorice. the heads of PIP2 are also depicted in tan licorice. (A1) structure of the DOPC/DOPE/PtdIns(4,5)P2 membrane system; (B1) PtdIns(3,4)P2 membrane. (A2,B2) snapshots from MD highlighting the topological distribution of the residues in the basic patch of the protein around PIP2 when they are inserted into the membrane.

