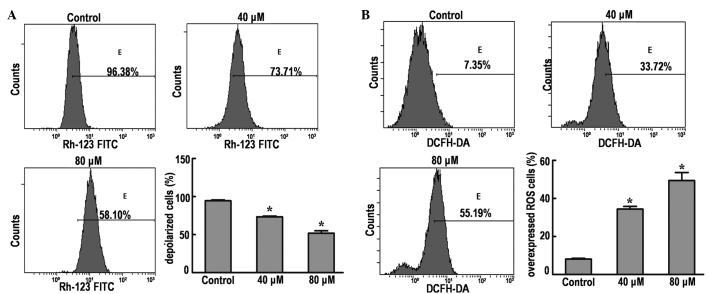
Figure 4.
Effects of DP treatment on MMP and ROS expression in SK-MES-1 cells by flow cytometric analysis. (A) Values represent the percentage of Rhodamine-123 fluorescence in SK-MES-1 cells. Cells were treated with 40 and 80 µM DP for 24 h. Representative histograms express the percentage of depolarized cells. (B) Values represent the percentage of DCFH-DA staining in SK-MES-1 cells. Cells were treated with 40 and 80 µM DP for 24 h. Representative histograms express the percentage of ROS overexpressing cells. All the data are expressed as the mean ± standard deviation of three independent experiments. *P<0.05 vs. control. FITC, fluorescein isothiocyanate; DCFH-DA, 2′,7′-dichlorofluorescein-diacetate; ROS, reactive oxygen species.

