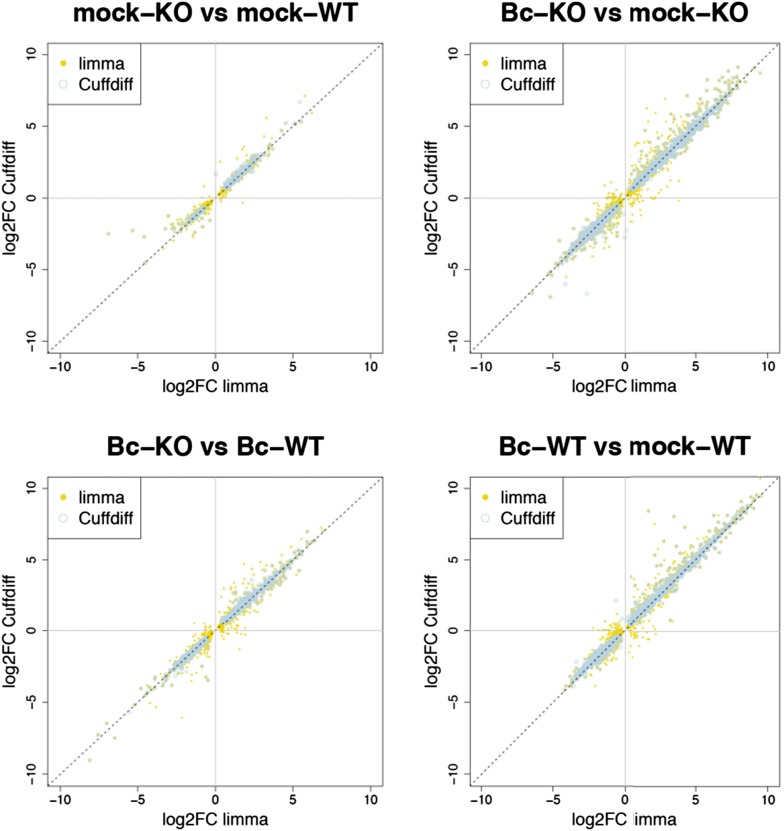
Author response image 3.
Plots show the correlation between the log2 fold changes obtained for each gene with limma (used in our study) and the alternative tool Cuffdiff. Yellow points represent genes identified with limma as significantly DE (p adj < 0.05), blue circles represent genes identified with Cuffdiff, and an overlap of both marks represents genes consistently identified with both tools.

