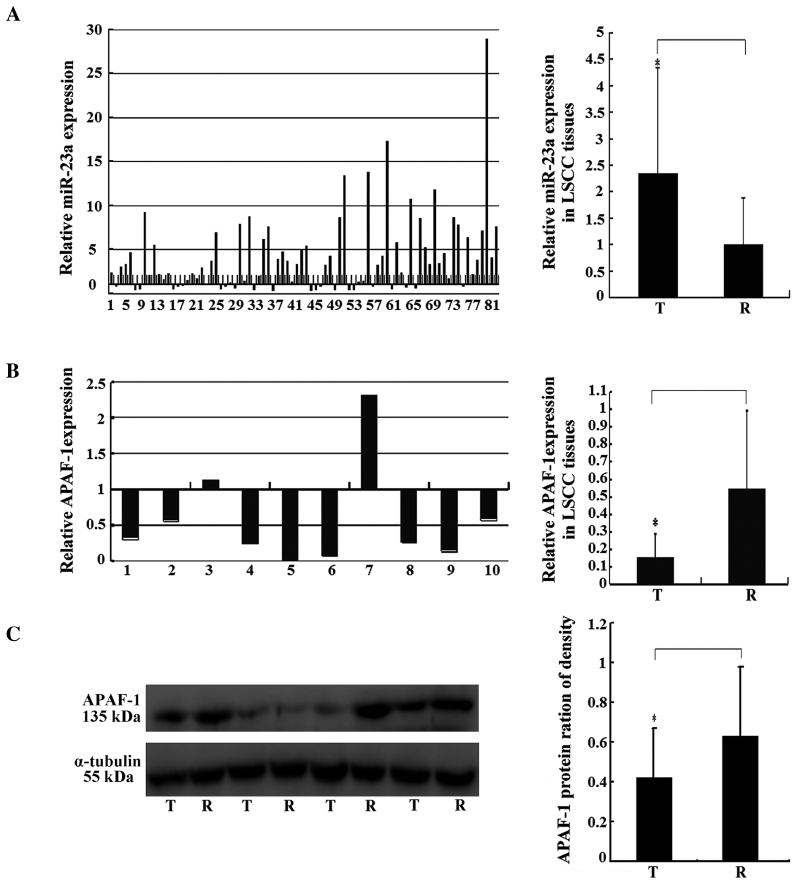
Figure 1.
miR-23a and APAF-1 gene expression in LSCC. (A) miR-23a expression in 82 pairs of LSCC tissues, analyzed by RT-qPCR. The y-axis indicates the ratio of relative miR-23a expression in cancer tissues to that in paired normal adjacent tissues. The relative expression was calculated as the ratio of miR-23a to the internal control, using the equation RQ=2−ΔΔCT in each sample. The x-axis represents the number of the paired samples used in the study. (B) Relative mRNA expression levels of APAF-1 in the miRNA-23a-upregulated LSCC tissues, analyzed by RT-qPCR. The y-axis indicates the ratio of relative APAF-1 mRNA expression in cancer tissues to that in paired normal adjacent tissues. The relative expression was calculated as the ratio of APAF-1 to the internal control using the equation RQ=2−ΔΔCT in each sample. The x-axis represents the number of the paired samples used in the study. (C) Relative protein expression levels of APAF-1 in the miRNA-23a-upregulated LSCC tissues, analyzed by western blotting. α-tubulin was used as the internal control. All data are expressed as the mean ± standard deviation of three independent experiments. *P<0.05. miRNA, microRNA; APAF-1, apoptotic protease activating factor 1; LSCC, laryngeal squamous cell carcinoma; RT-qPCR, reverse transcription-quantitative polymerase chain reaction; T, tumor sample; R, paired normal adjacent sample.

