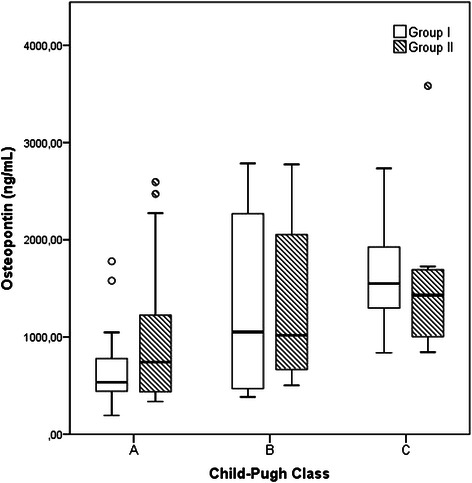
Fig. 1.

Plasma osteopontin (OPN) levels according to Child-Pugh class in patients with cirrhosis (Group I) and cirrhosis with hepatocellular carcinoma (Group II). Box refers to the 25th and 75th percentile values, with a line indicating median levels, whereas the interquartile range extends outside the box. Points outside the interquartile range are outliers. The plasma OPN level was progressively increased according to the Child-Pugh class in both groups
