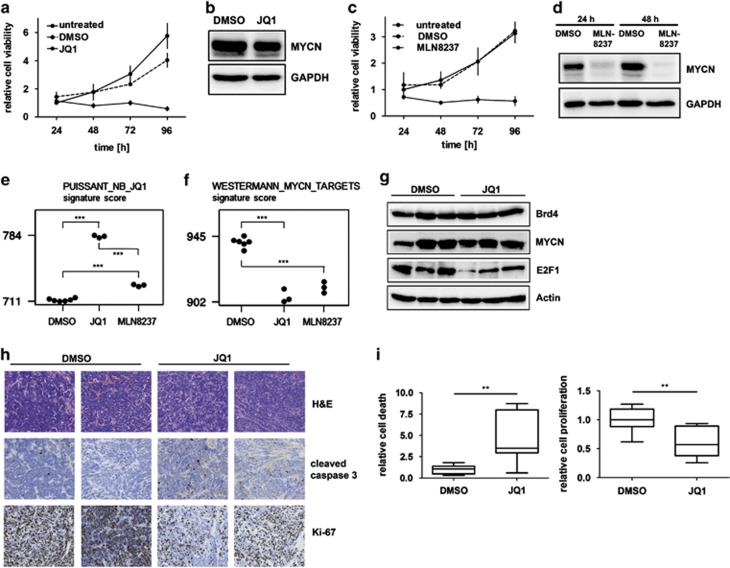
Figure 7.
Treatment of mNB-A1 and re-grafted tumors. (a) JQ1 treatment of mNB-A1 cells significantly reduced cell viability in MTT assays compared with untreated or DMSO-treated cells. (b) Western blot analysis confirmed no MYCN protein regulation in mNB-A1 cells treated with JQ1 compared with DMSO-treated cells. (c) MLN8237 treatment of mNB-A1 cells significantly reduced cell viability in MTT assays compared with untreated or DMSO-treated cells. (d) Western blot analysis confirmed MYCN downregulation in mNB-A1 cells treated with MLN8237 compared with DMSO-treated cells. (e, f) A mRNA signature score established from genes differentially expressed after JQ1 treatment of neuroblastoma cell lines16 (e), and a MYCN mRNA signature score14 (f) for mNB-A1 cells treated with either DMSO, JQ1 or MLN8237. (g) Western blot analyses of Brd4, MYCN, Myc, E2f1 and Cyclin D1 expression in re-grafted tumors from LSL-MYCN;Dbh-iCre mice treated with JQ1 or DMSO. Actin and Gapdh were used as loading controls. (h) Re-grafted tumors from JQ1- or DMSO-treated mice were examined histologically after hematoxylin/eosin (H&E) staining or immunostaining for cleaved caspase 3 (apoptotic cells) or Ki-67 (actively proliferating cells). Representative images are shown. (i) Bar graphs show the mean relative apoptosis (left) and proliferation (right) calculated from three representative images from each re-grafted tumor from groups of mice treated with either JQ1 or DMSO. Significance was calculated by Student's t-test: *P<0.05, **P<0.01, ***P<0.001.

