
Fig. 6.
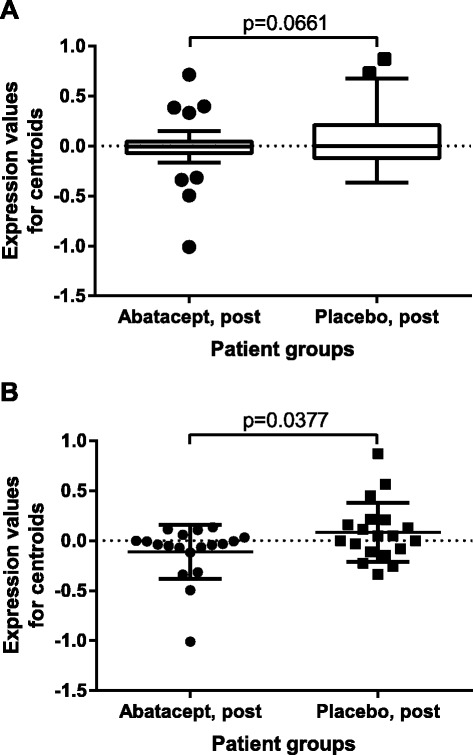
CD28 pathway trends across abatacept and placebo post-treatment groups. a Comparison of expression centroids for the entire set of genes annotated to CD28 pathway. p-value is for unpaired t-test with Welch’s correction. Graph is Tukey’s box and whiskers plot. b Comparison of expression centroids for the core enrichment subset of CD28 pathway from Fig. 3. p-value is for unpaired t-test. Graph shows mean with SD scatter plot