
Fig. 3.
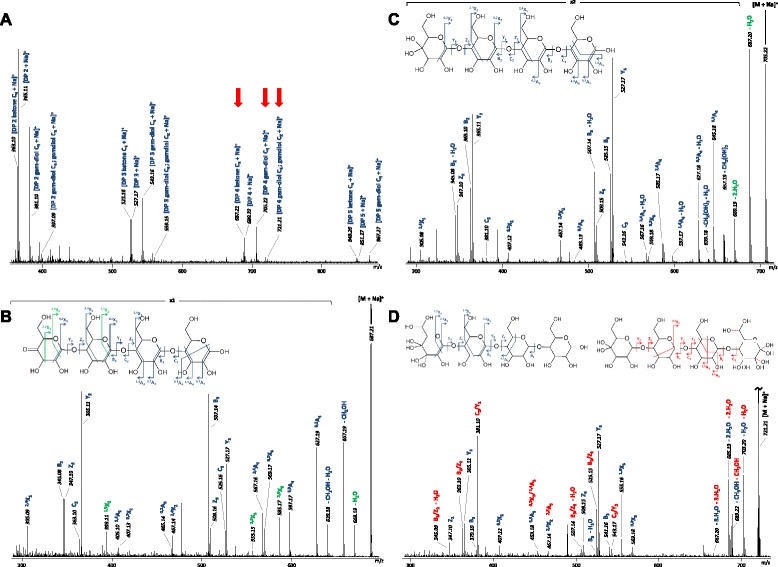
Mass spectrometry analysis of degradation products generated by PaLPMO9H. a Analysis was performed after 16 h of cellulose degradation. The main panel shows the full spectrum of sample with peaks corresponding to native and oxidized cello-oligosaccharides. Fragmented peaks are indicated by arrows. The panels below b, c, and d show the DP4 peaks with m/z value of 687.21, 705.22, and 721.21, respectively, that were fragmented using ESI MS. The oxidized oligosaccharides product species are represented in panels b, c, and d based on the fragmentation patterns. In panel d, the different product species corresponding to the fragmentation pattern are indicated by blue and red dotted bonds