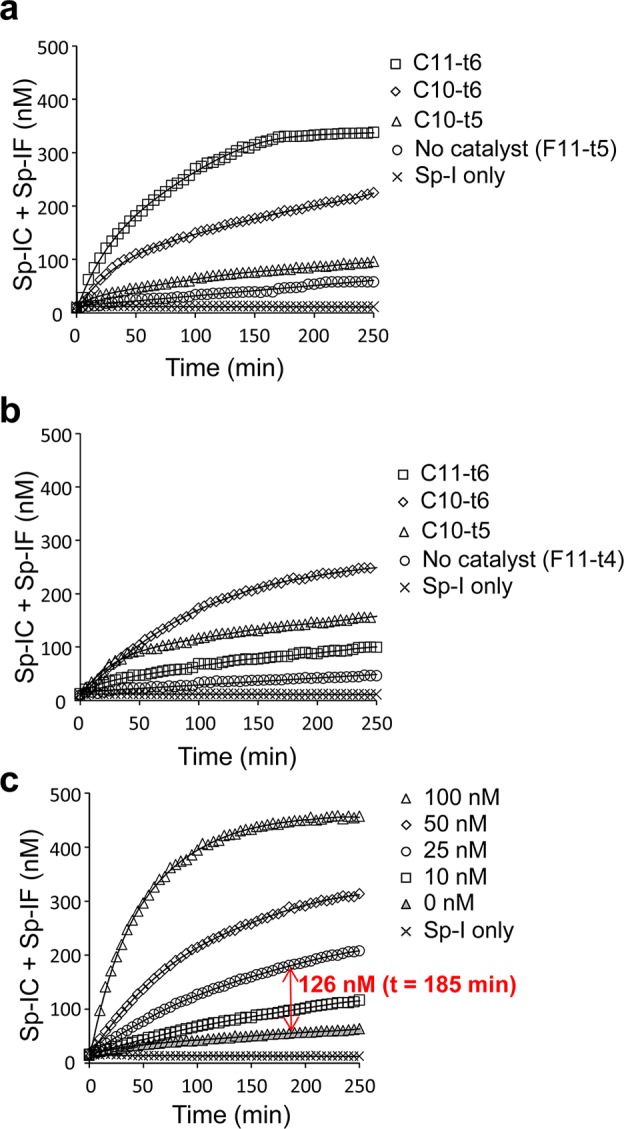
Figure 2.

Characterization of the catalytic RNA signal amplification circuits. (a) Activation of Sp-I (500 nM) fluorescence in the presence of F11-t5 (1000 nM) with or without a catalytic strand (C11-t6, C10-t6, C10-t5; 50 nM) over time. (b) Activation of Sp-I (500 nM) fluorescence in the presence of F11-t4 (1000 nM) with or without a catalytic strand (C11-t6, C10-t6, C10-t5; 50 nM) over time. (c) Activation of Sp-I (500 nM) fluorescence in the presence of F11-t5 (1000 nM) with or without different concentrations of C11-t6 over time. (a–c) The reactions were performed as described in the Methods, and the average fluorescence values from triplicate experiments were plotted. The triplicate measurements were typically within 3% of the plotted average values, which were smaller than the data symbols shown.
