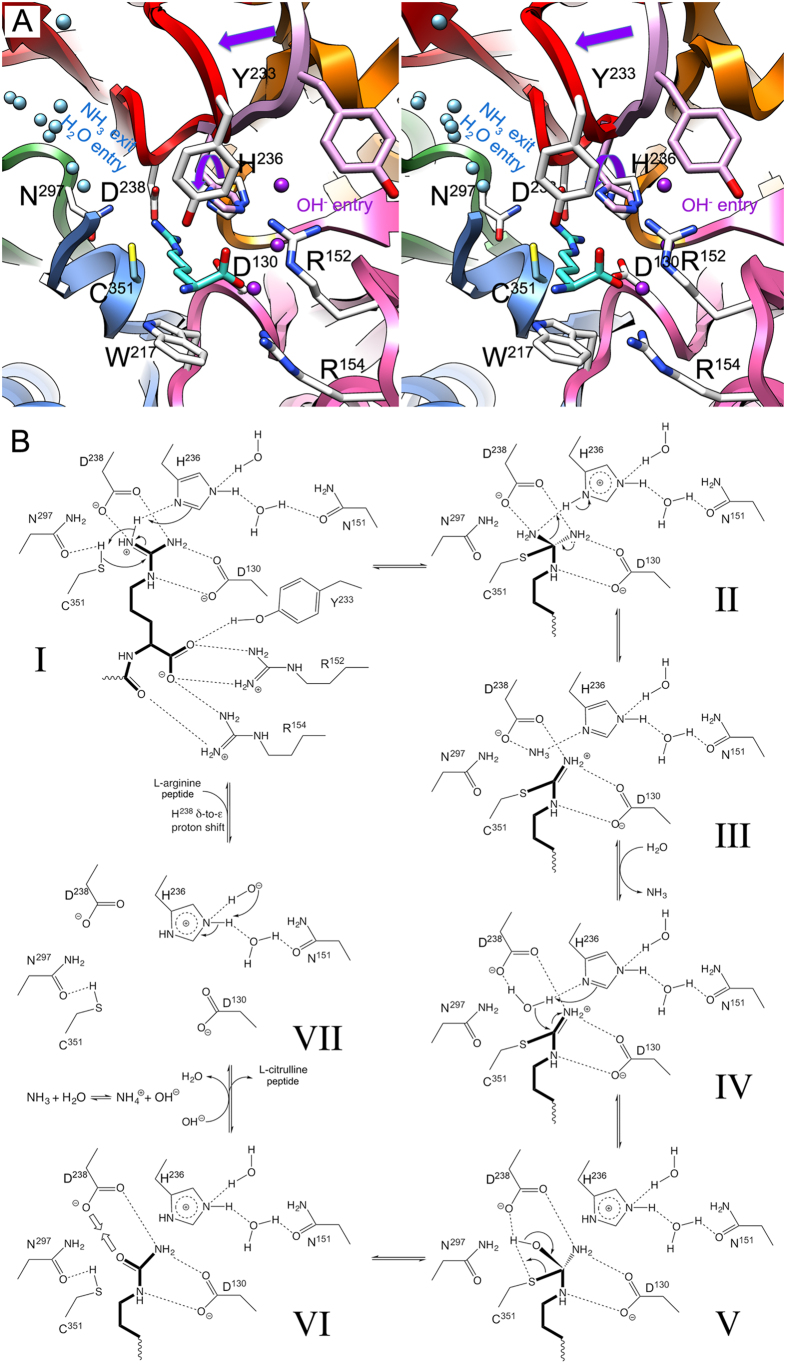
Figure 4. Proposed peptide citrullinating mechanism of PPAD.
(A) Composite picture in stereo of the active site of PPAD (see also Fig. 2) based on the substrate-mimic complex ribbon plot colored as in Fig. 2b. Only elements engaged in substrate binding and catalysis are depicted. Residue side chains taken from the substrate-mimic complex are shown with carbons in light blue (C351), those from the substrate complex in white (Y233, H236, D238, N297, R152, R154, and W217), and those from the unbound structure in pink (Y233 and H236). The Michaelis loop is shown in the open conformation of the unbound structure in pink and in the occluded conformation of the substrate(-mimic) complexes in red, a purple straight arrow highlights the rearrangement upon substrate binding. The substrate arginine depicted belongs to the substrate complex (carbons in turquoise). Solvent molecules from the substrate-mimic complex in light blue highlight the NH3-exit/H2O-entry channel on the left and those in purple the hydroxide-entry channel on the right. The rotation of the H236 side chain from the substrate-unbound to the bound conformation is pinpointed by a curved purple arrow. (B) Proposed biochemical mechanism of action of an enzymatic activity cycle in seven steps (I to VII). The substrate arginine and product citrulline are shown with bonds in bold, hydrogen bonds are shown as dashed lines.

