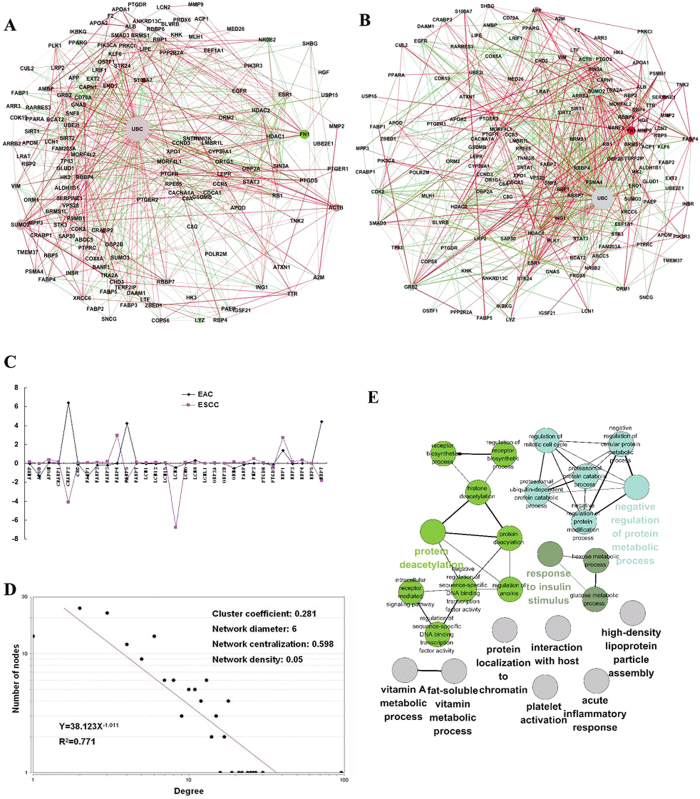
Figure 3.
(A-B) The human lipocalin protein-protein interaction network and the lipocalins’ changes in expression in esophageal adenocarcinoma and esophageal squamous cell carcinoma are shown. The lipocalins are shown using triangles, and their interacting proteins are shown in circles. Red indicates upregulation and green indicates downregulation. The size of the node indicates the degree (the number of its interacting proteins) of the node. Bigger nodes have higher degrees. The connection between two nodes is indicated by an edge. Red edges indicate positive correlations in the expression of two proteins, and green edges indicate negative correlations. Correlation strength is shown by the edge width. (C) Expression levels of lipocalins in esophageal adenocarcinoma and esophageal squamous cell carcinoma. (D) The power law distribution of the node degree network and analysis of other network parameters. (E) Functional map of the lipocalins PPIN. Functionally grouped network with GO terms are represented as nodes, which were linked based on their kappa score level (≥0.3), suggesting overlapped enriched genes. The similar GO terms were labeled in the same color.

