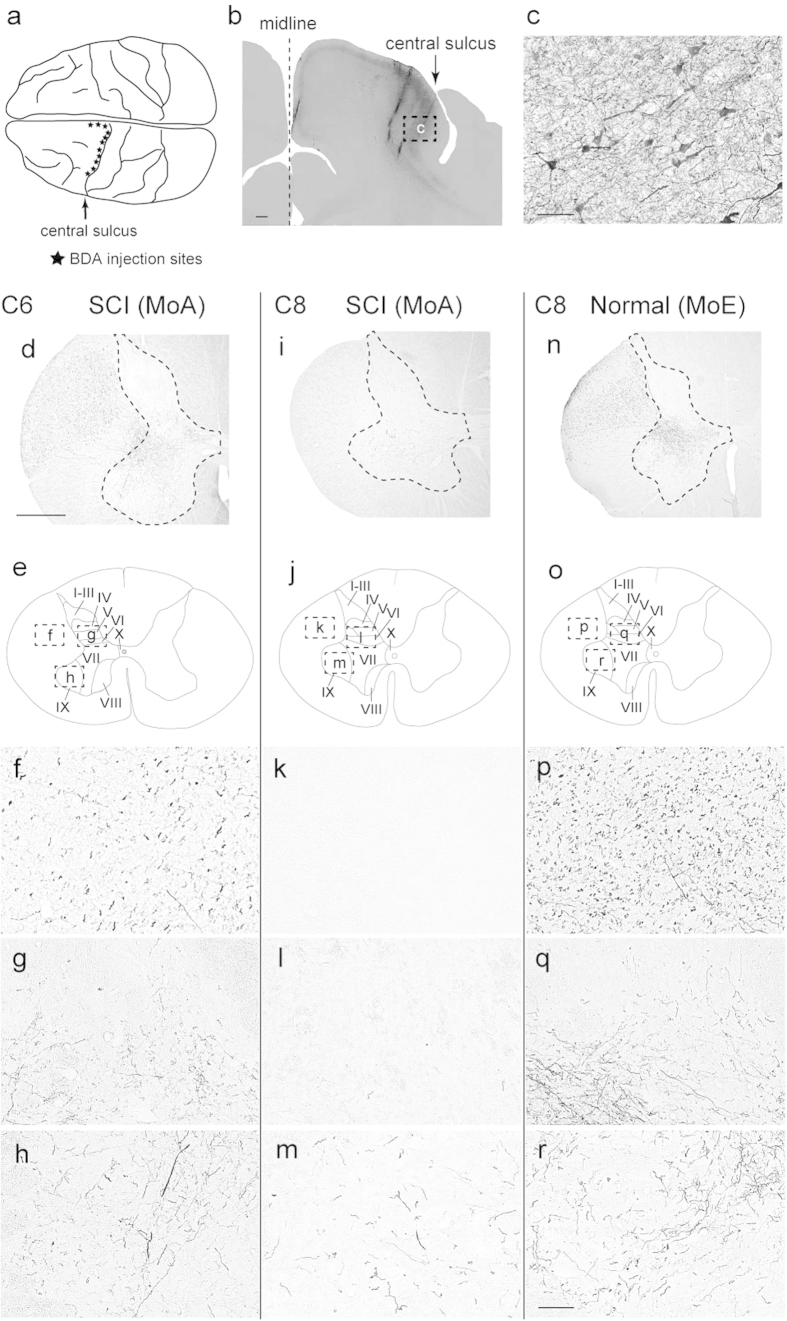
Figure 3. Immunohistochemical analyses of the sites of BDA injections in the MI and the distribution of BDA-labeled CST fibers.
(a) Sites of BDA injections in MI regions representing the forelimb, trunk, and hindlimb (denoted with stars). (b) Example of the injection site in the forelimb region. Scale bar: 1 mm. (c) Higher-power magnification of a rectangular area in b. Scale bar: 50 μm. (d,i,n) Representative transverse sections through the C6 (d) and C8 (i) segments in an SCI model (MoA) and the C8 segment (n) in a normal control (MoE). Scale bar: 1 mm. (f–h) Higher-power magnification of rectangular areas in e. (k–m) Higher-power magnification of rectangular areas in j. (p–r) Higher-power magnification of rectangular areas in o. f,k,p: Laterally-situated CST fibers. g,l,q: Laminae IV to VI. h,m,r: Lamina XI. Scale bar: 100 μm.

