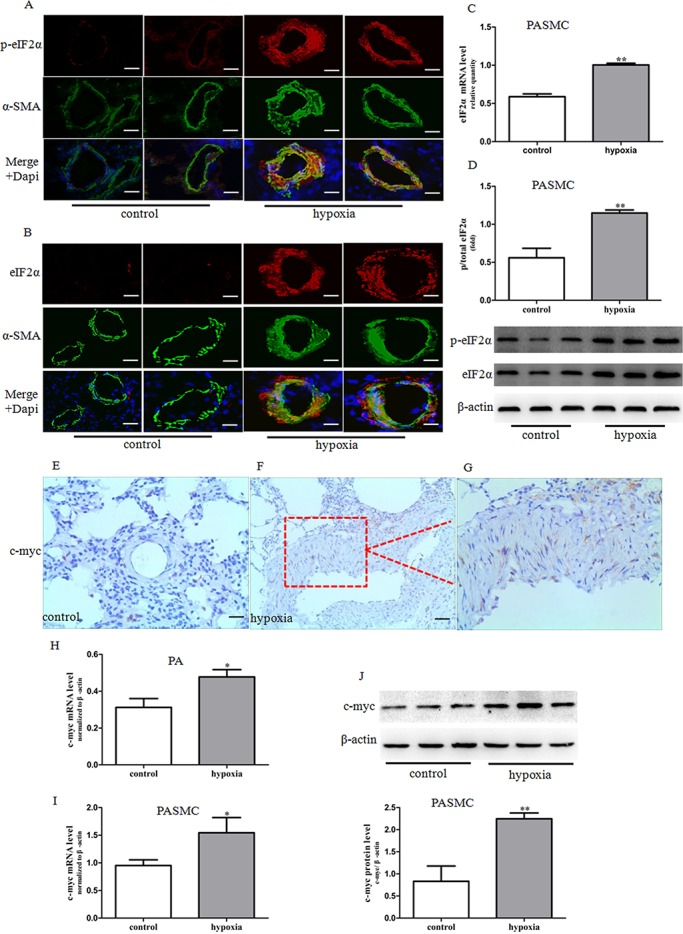
Fig 2. Expression and activity of eIF2α and c-myc expression in pulmonary arteries from HPH rats and PASMCs under hypoxic conditions.

(A-B) Dual immunofluorescence analysis with anti-p-eIF2α (red), anti-eIF2α (red) and anti-SMA antibodies (green) in lung tissue specimens in rats. Images were acquired with an Olympus BX51 microscope, scale bars = 100um. (C) The mRNA expression of eIF2α was determined by real-time PCR in PASMCs. (D) The phosphorylation of eIF2α proteins was determined by western blot in PASMCs. Data represent fold changes in p-eIF2α/total eIF2αprotein ratios. (E-G) The expression of c-myc protein was determined by immunohistochemistry staining (brown precipitate indicates c-myc positive staining). Images (E, F) were taken under ×20 magnification. G is an enlarged portion of the red box in E. (H) The expression of c-myc mRNA was determined by real-time PCR in pulmonary arteries. (I) The expression of c-myc mRNA was determined by real-time PCR in PASMCs. (J) The expression of c-myc protein was determined by western blot in PASMCs. Control: cells were treated with 21% O2 for 48 h. Hypoxia: cells were treated with 3% O2 for 48 h. Data are means ±S.E.M. n = 3. *P<0.05 vs. control; **P<0.01 vs. control.
