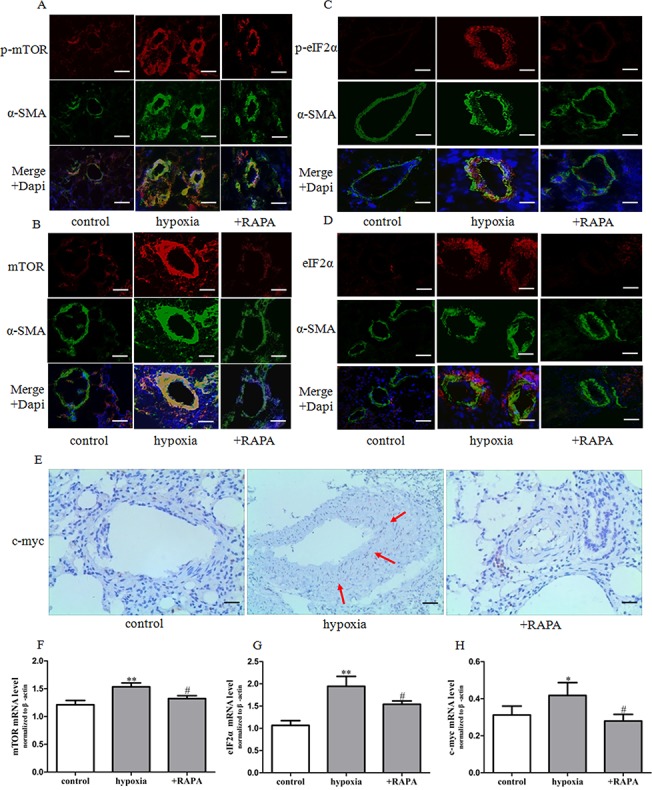
Fig 4. Effect of rapamycin on mTOR, eIF2α and c-myc expression and activity in HPH rats.

(A-D) Dual immunofluorescence analysis with anti-p-mTOR (red), anti-mTOR (red), anti-p-eIF2α (red), anti-eIF2α (red), and anti-SMA antibodies (green) in lung tissue specimens in rats. Images were acquired with an Olympus BX51 microscope, scale bars = 100um. (E) The expression of c-myc protein was determined by immunohistochemistry staining (brown precipitate indicates c-myc positive staining) scale bars = 200um. (F-H) The expression of mTOR, eIF2α and c-myc mRNA was determined by real-time PCR in pulmonary arteries. Data are means ± S.E.M. n = 8. RAPA: rapamycin. *P<0.05 vs. control; **P<0.01 vs. control; # P<0.05 vs. hypoxia.
