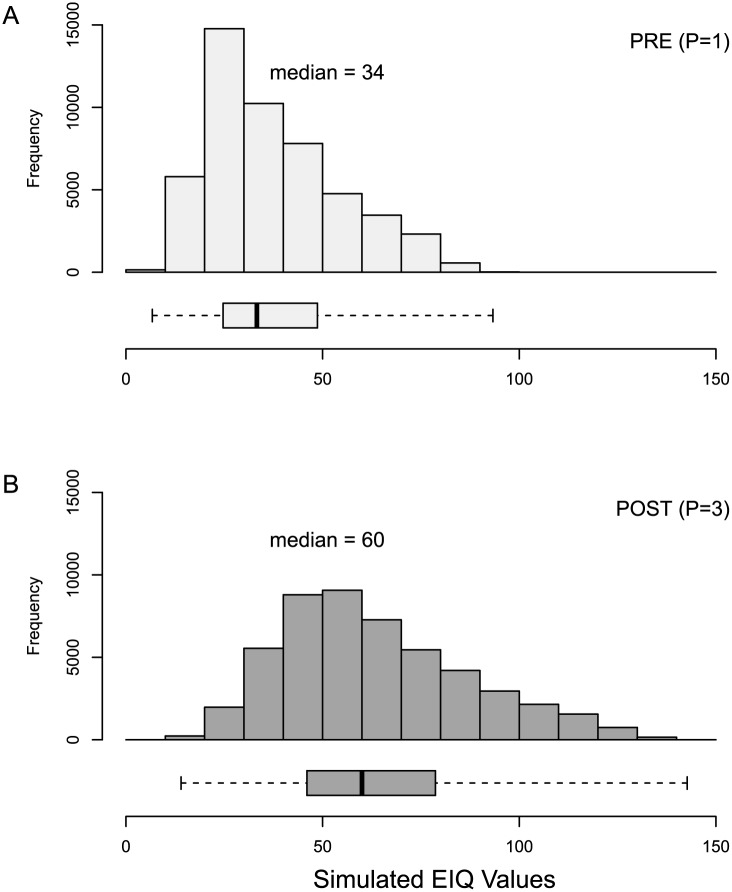
Fig 2. Histogram of Monte Carlo simulation of 100,000 EIQ values calculated by random draws of values for risk factors included in the EIQ formula (Eq 1).
For box-plots, dark bars represent median EIQ value, boxes enclose the first and third quartiles, and whiskers extend to minimum and maximum observed EIQ values.

