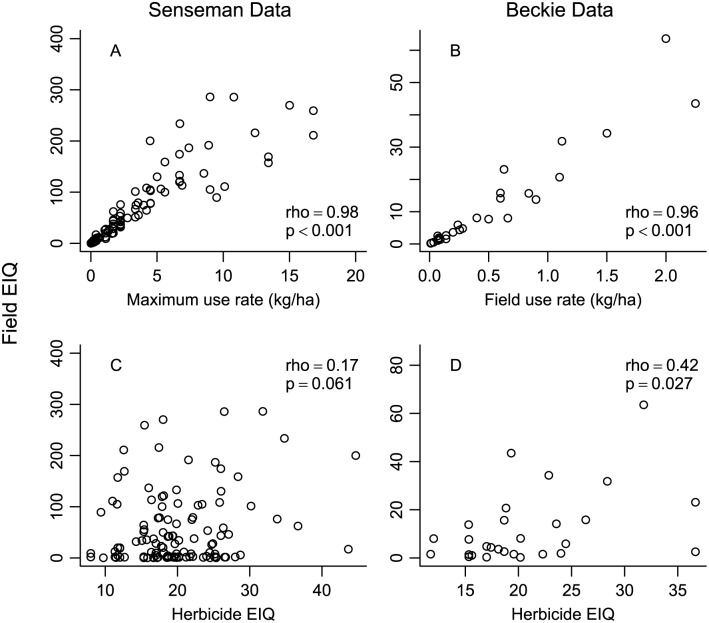
Fig 3. Relationship between Field EIQ and herbicide use rate (A,B) and the EIQ (C,D) for two herbicide data sets.
(A) Relationship between maximum herbicide use rate and Field EIQ for Senseman data set; (B) relationship between herbicide field use rate and Field EIQ for Beckie data set; (C) relationship between herbicide EIQ and Field EIQ for the Senseman data set; (D) relationship between herbicide EIQ and Field EIQ for the Beckie data set. Spearman’s rank correlation rho and P-value are provided in each panel.

