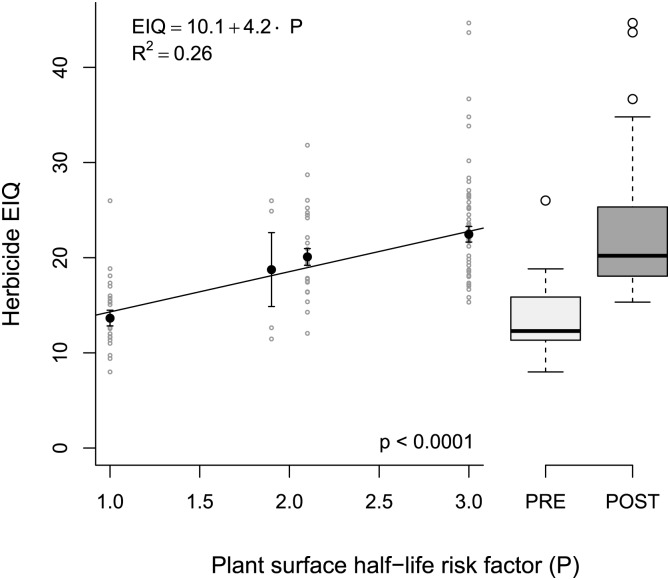
Fig 4. The relationship between plant surface half-life risk factor (P) and EIQ value for 116 herbicides (Senseman data set).
Filled circles with error bars represent means and standard errors, grey open circles represent individual herbicides (N = 116). For box-plots, dark bars represent median EIQ value, boxes enclose the first and third quartiles; preemergence (PRE) and postemergence (POST) boxplots represent the data for P = 1 and P = 3, respectively.

