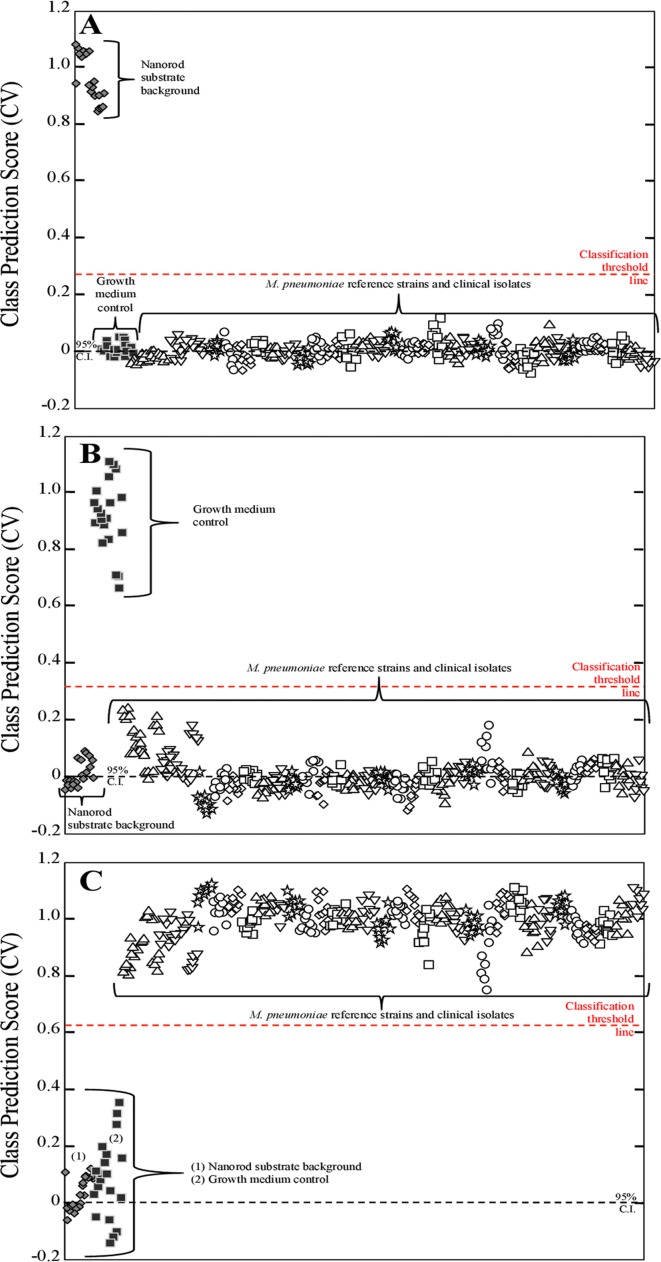
Fig 2. PLS-DA of 32 M. pneumoniae clinical isolates, including reference strains M129 and FH.
Each panel represents a cross-validated class prediction score for (A) class 1, substrate background; (B) class 2, growth medium control; and (C) class 3, all M. pneumoniae strains. For panels A-C, each individual shape represents a single pre-processed NA-SERS spectrum. The substrate background spectra are represented by gray diamonds, the growth medium control spectra by solid black squares, and the M. pneumoniae spectra by open shapes that differ by cluster to indicate the different individual strains and isolates. The red-dotted line indicates the classification threshold line for positive class prediction, and the black-dotted line indicates the 95% confidence interval. Cross-validated sensitivity, specificity, and class error for the panels were as follows: (A) nanorod substrate background: 1.00, 1.00, and 0, respectively; for (B) growth medium control: 1.00, 1.00, and 0, respectively; and for (C) M. pneumoniae: 1.00, 1.00, and 0, respectively. Cross-validated statistics were obtained using Venetian blinds with 10 data splits to represent the prediction performance of the PLS-DA model for M. pneumoniae detection.

