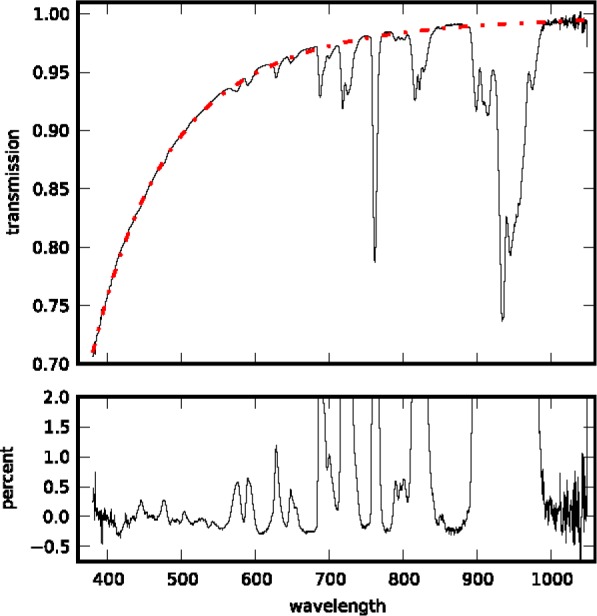
Fig. 2.

The top panel shows atmospheric transmission resulting from the Beer-Lambert-Bougher law analysis of our lunar measurements (black line) together with the Rayleigh transmission calculated from radiosonde profiles (red dash-dotted line). The lower panel shows the percent difference between measurement and calculation. The discrepancies are due to oxygen and water vapor absorption.
