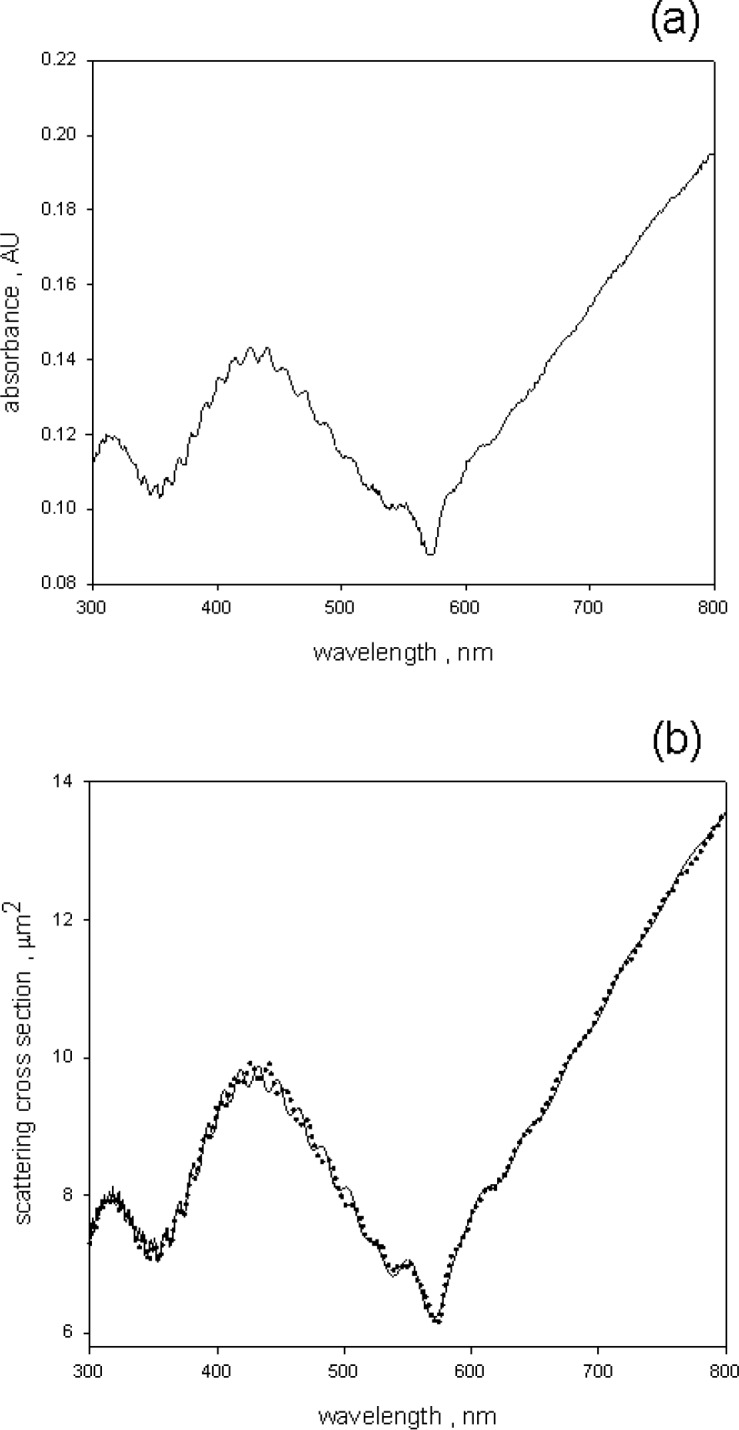
Fig. 10.

(a) The solid trace (labeled A1-A in the text) shows the result of subtracting the corrected microsphere absorbance shown in Fig. 8 from the microsphere absorbance measured in holder 1. The effect of BODIPY@ dye is apparent in the region around 571 nm. (b) The solid circles are reproduced from (a) and the solid line is the best fit to the data. The calculation used the imaginary index obtained from the analysis of the absorbance (Fig. 8), and varied all of the other parameters to get the best correspondence with the measurements. The parameter c defined in Eq. (10) gave the number concentration of the microspheres.
