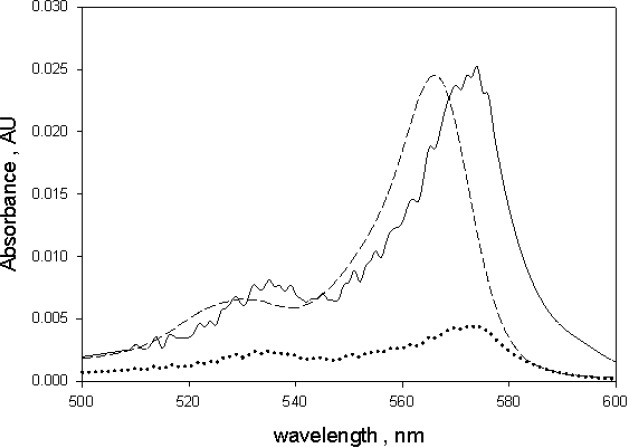
Fig. 7.
The dotted trace reproduces the trace from Fig. 3 and shows the absorbance of dyed microspheres as measured with the suspension inside the IS detector. The solid trace is the corrected absorbance using Eq. (1) in the text and the correction factor m given in Fig. 6. The quantum yield of the dyed microspheres was found using data in Fig. 5. The dashed trace is the normalized absorbance of BODIPY@ dye in ethanol. The spectral shapes of the absorbance in ethanol and polystyrene are very similar, however the spectrum of BODIPY@ dye in polystyrene is shifted to the red by about 9 nm.

