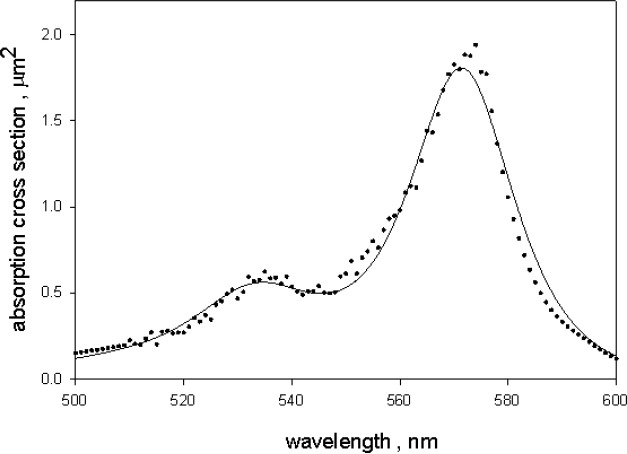
Fig. 8.
The solid circles show the absorption cross section of dyed microspheres. The values were obtained by dividing the corrected absorption (solid trace in Fig. 7) by the microsphere number concentration obtained from the fit to the scattering cross section. The solid trace is the calculated cross section using an imaginary index of refraction represented by three Gaussian-Lorentz peaks, and other parameters obtained from the fit to the scattering cross section.

