Fig. 17.

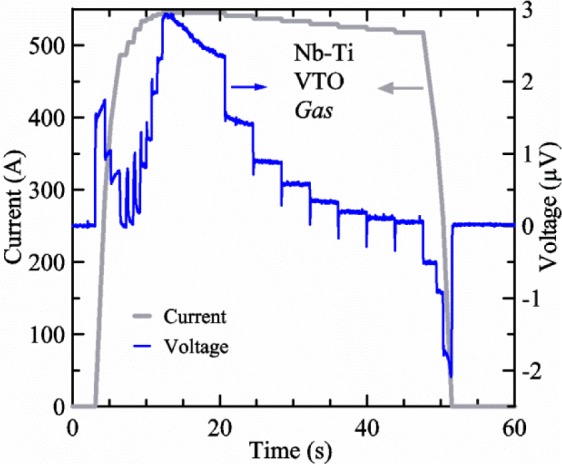
Sample current (left axis) and voltage (right axis) versus time measured on a Nb-Ti sample at 3 T and 5 K, in flowing helium gas, using the VTO probe. There are about 3,000 readings of each the two signals.

Sample current (left axis) and voltage (right axis) versus time measured on a Nb-Ti sample at 3 T and 5 K, in flowing helium gas, using the VTO probe. There are about 3,000 readings of each the two signals.