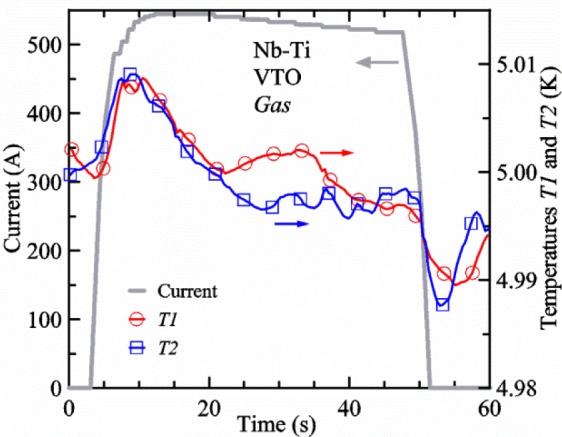
Fig. 18.

Sample current (left axis) and temperatures T1 and T2 (right axis) versus time measured on a Nb-Ti sample at 3 T and 5 K, in flowing helium gas, and using the VTO probe. All of the readings are plotted, but the symbols for the two temperatures are plotted only on every 10th point. These data were taken during the same curve as in Fig. 17.
