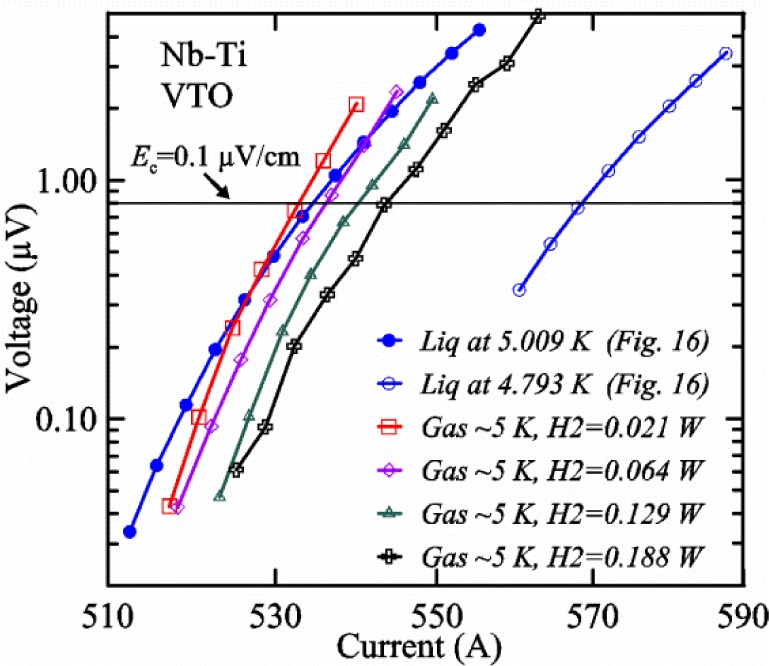
Fig. 22.

A full-logarithmic scale plot of V-I curves measured on a Nb-Ti sample in liquid and in gas with different H2 powers (average when I near Ic) using the VTO probe. Part of the curve at 4.8 K in liquid is covered by the legend.

A full-logarithmic scale plot of V-I curves measured on a Nb-Ti sample in liquid and in gas with different H2 powers (average when I near Ic) using the VTO probe. Part of the curve at 4.8 K in liquid is covered by the legend.