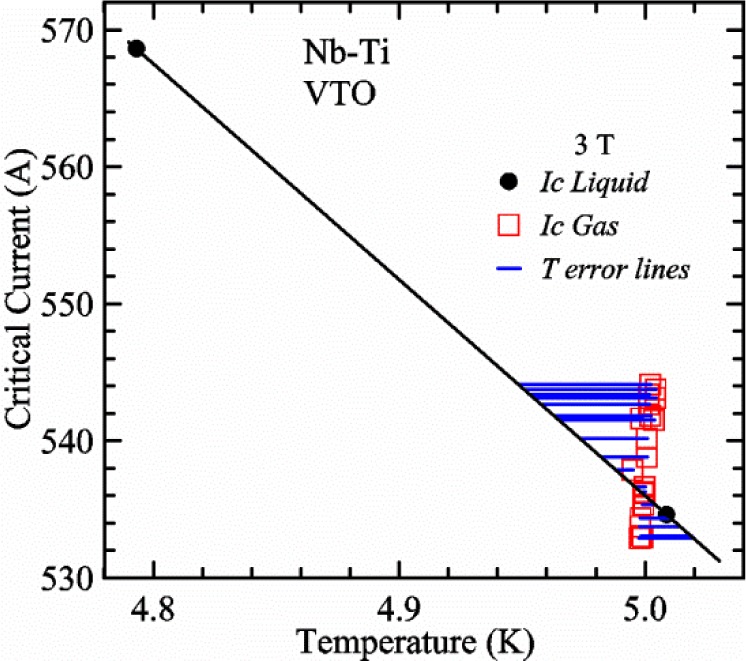
Fig. 23.

Critical current versus temperature on a Nb-Ti sample measured using the VTO probe in liquid helium and in flowing helium gas at 3 T. The solid black line indicates the expected linear dependence of Ic(T). The horizontal blue lines indicate the T error for the measurements in gas with different heater power levels.
