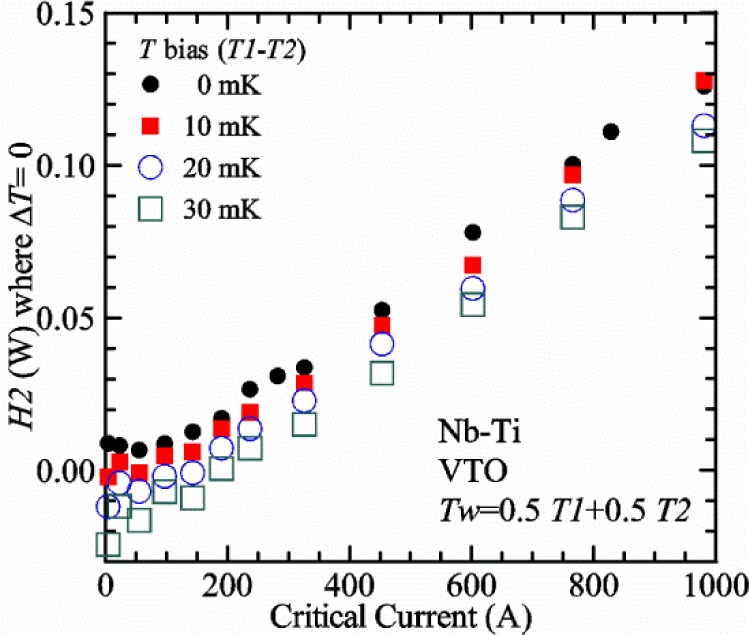
Fig. 41.

Plot of H2 where ΔT = 0 versus Ic at 5 K for a Nb-Ti wire soldered to a stainless-steel mandrel on the VTO probe. The T bias (T1−T2) was set to 0, 10, 20, and 30 mK. The weighted temperature Tw = 0.5 T1+0.5 T2 was used to determine the correct Ic.
