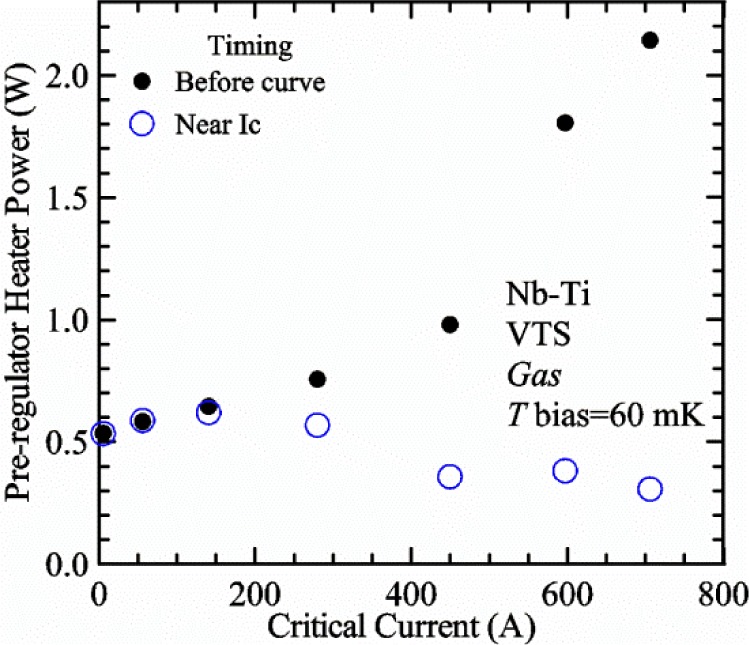
Fig. 46.

Pre-regulator heater power versus Ic for a set of measurements on a Nb-Ti sample at 5 K, in gas, and on the VTS probe. The solid circle symbols indicate the average heater power before each V-I curve was taken and the open circle symbols indicate the average heater power during the time that the sample current was near Ic. T bias (T1−T2) was set to 60 mK.
