
Fig. 5.
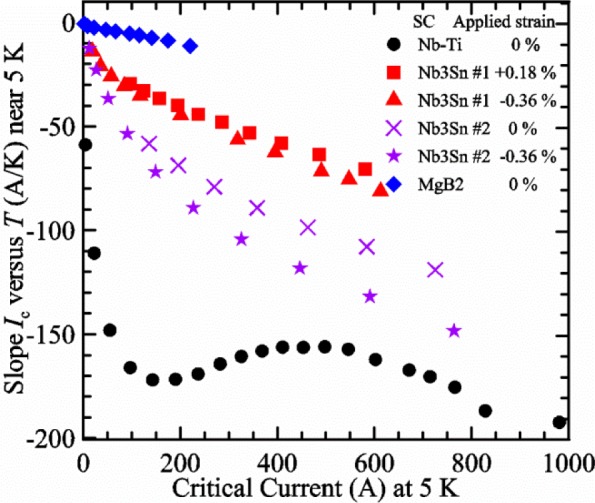
Slope of critical current versus temperature near 5 K plotted versus critical current at 5 K for various samples and applied strains.
Official websites use .gov
A
.gov website belongs to an official
government organization in the United States.
Secure .gov websites use HTTPS
A lock (
) or https:// means you've safely
connected to the .gov website. Share sensitive
information only on official, secure websites.
Slope of critical current versus temperature near 5 K plotted versus critical current at 5 K for various samples and applied strains.