Fig. 57.

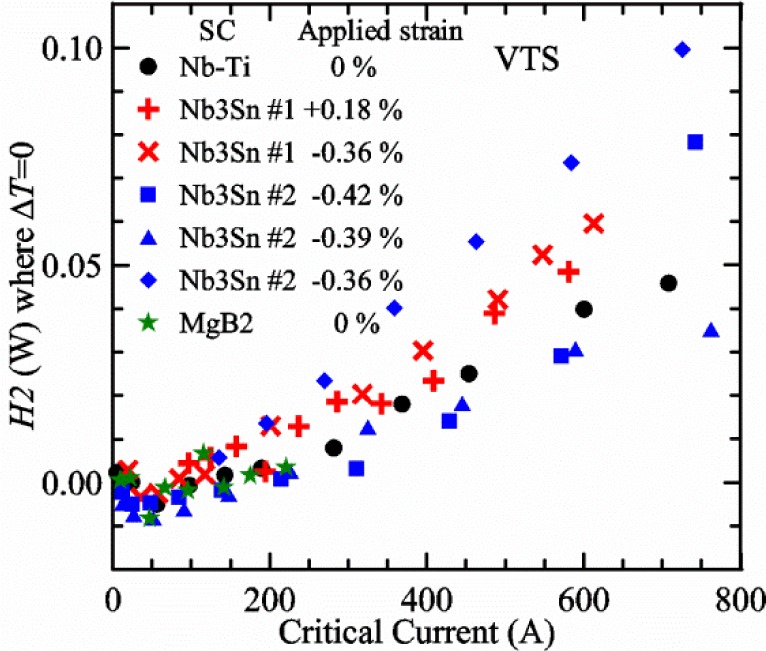
Plot of H2 where ΔT = 0 versus Ic for four samples that were soldered to the spring of the VTS probe. Some of the samples were measured under different applied strains and conditions. This is part of the correct protocol for VTM.

Plot of H2 where ΔT = 0 versus Ic for four samples that were soldered to the spring of the VTS probe. Some of the samples were measured under different applied strains and conditions. This is part of the correct protocol for VTM.