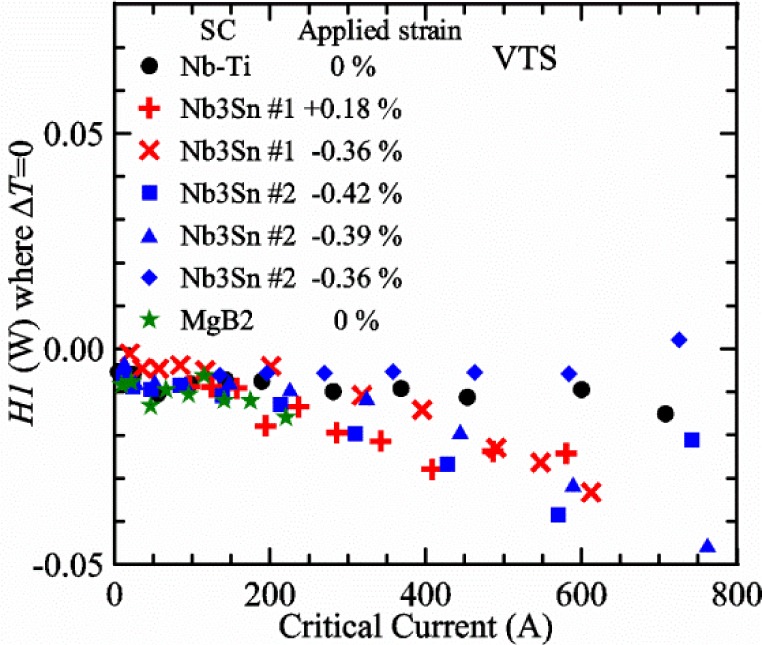
Fig. 58.

Plot of H1 where ΔT = 0 versus Ic for four samples that were soldered to the spring of the VTS probe. Some of the samples were measured under different applied strains and conditions.

Plot of H1 where ΔT = 0 versus Ic for four samples that were soldered to the spring of the VTS probe. Some of the samples were measured under different applied strains and conditions.