Fig. 9.

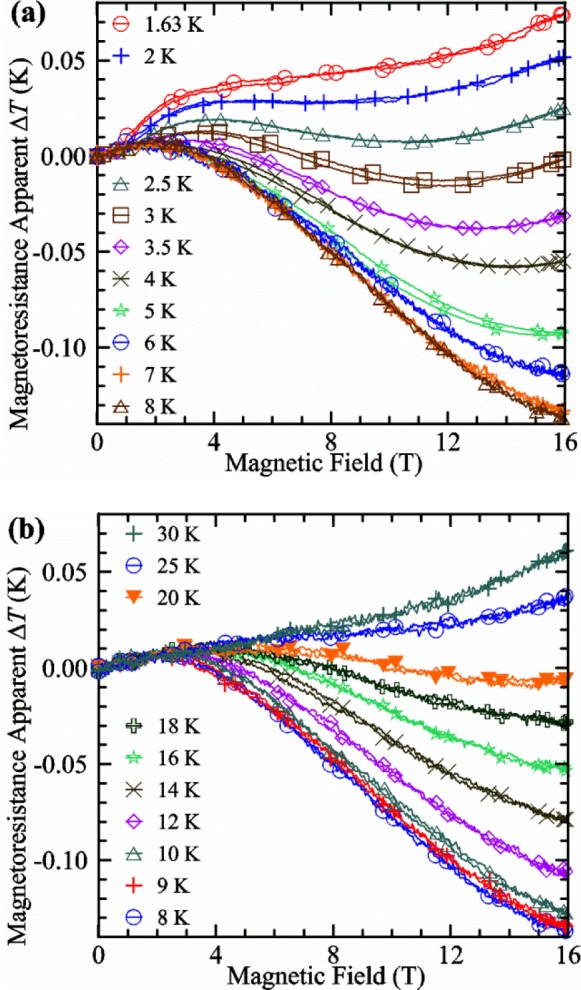
Apparent change in temperature due to magnetoresistance versus magnetic field for various temperatures from (a) 1.63 to 8 K and (b) 8 to 30 K. All of the readings are plotted, but the symbols are plotted only on every 100th point.

Apparent change in temperature due to magnetoresistance versus magnetic field for various temperatures from (a) 1.63 to 8 K and (b) 8 to 30 K. All of the readings are plotted, but the symbols are plotted only on every 100th point.