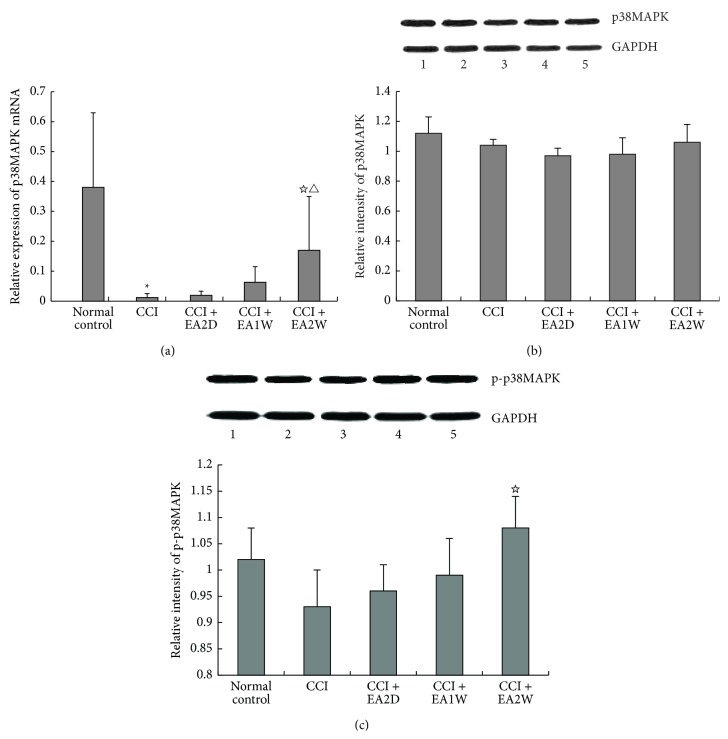
Figure 5.
Effect of EA on expression levels of hippocampal p38MAPKmRNA and p38MAPK and p-p38MAPK proteins in different groups. Hippocampal p38MAPK mRNA and p-38MAPK and p-p38MAPK protein expression levels were assayed by real-time PCR and Western blot, respectively. Data are presented as mean ± SD (∗ P < 0.05, compared with the sham control group; ☆ P < 0.05, compared with the CCI group; △ P < 0.05, compared with the CCI + EA2D group; n = 6 in each group for real-time PCR; n = 5 for each group for Western blot). (a) Histograms of real-time PCR show the expression levels of p38MAPKmRNA in the 5 groups; (b) the top panel shows the representative immunoblots of p38MAPK protein and GAPDH in (1) sham control group, (2) CCI group, (3) CCI + EA2D group, (4) CCI + EA1W group, and (5) CCI + EA2W group. The histograms show the relative expression levels of p38MAPK protein in the 5 groups. (c) Upper panel shows the representative immunoblots of p-p38MAPK in (1) normal control group, (2) CCI group, (3) CCI + EA2D group, (4) CCI + EA1W group, and (5) CCI + EA2W group. The histograms show the relative expression levels of p-p38MAPK protein in the 5 groups.

