
Fig. 2.
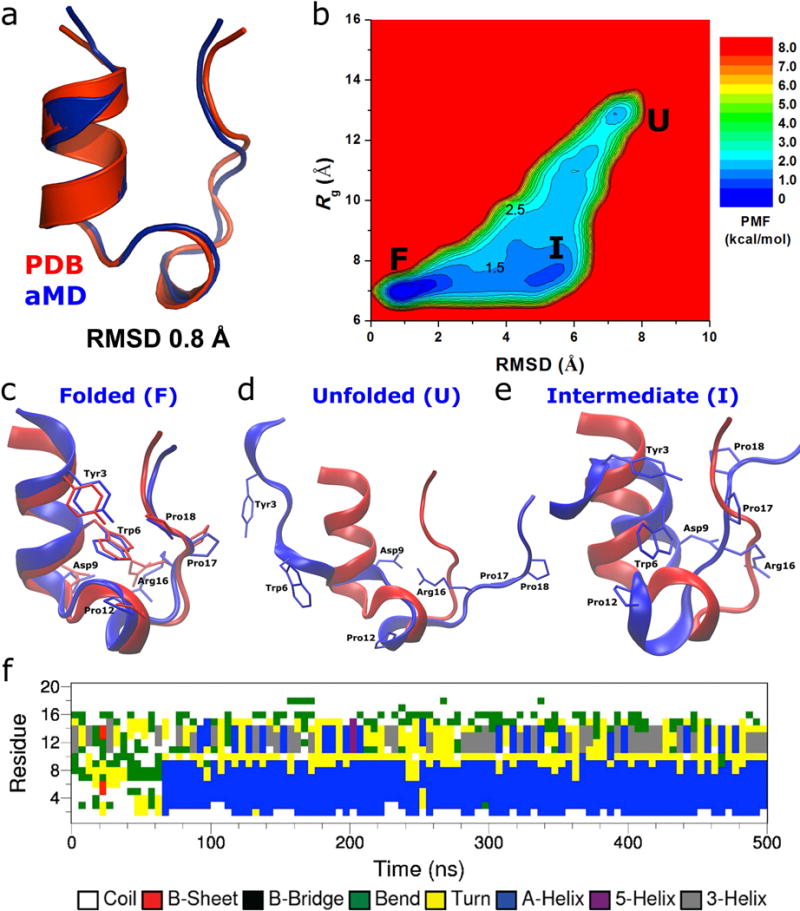
Folding of Trp-cage simulated via aMD: (a) comparison of simulation-folded Trp-cage (blue) with the PDB (2JOF) native structure (red) that exhibits 0.8 Å RMSD at t=120 ns in Sim1 (Fig. S4), (b) two-dimensional (RMSD, Rg) free energy profiles calculated by reweighting the four 500 ns aMD simulations combined, structural representations of the (c) folded (“F”), (d) unfolded (“U”) and (e) intermediate (“I”) states (blue) aligned to the native structure (red), and (f) time evolution of the protein secondary structure during the 500 ns aMD simulation containing the folded structure shown in (a), in which the α-helix (blue) starts to form at ~ 65 ns.