
Fig. 3.
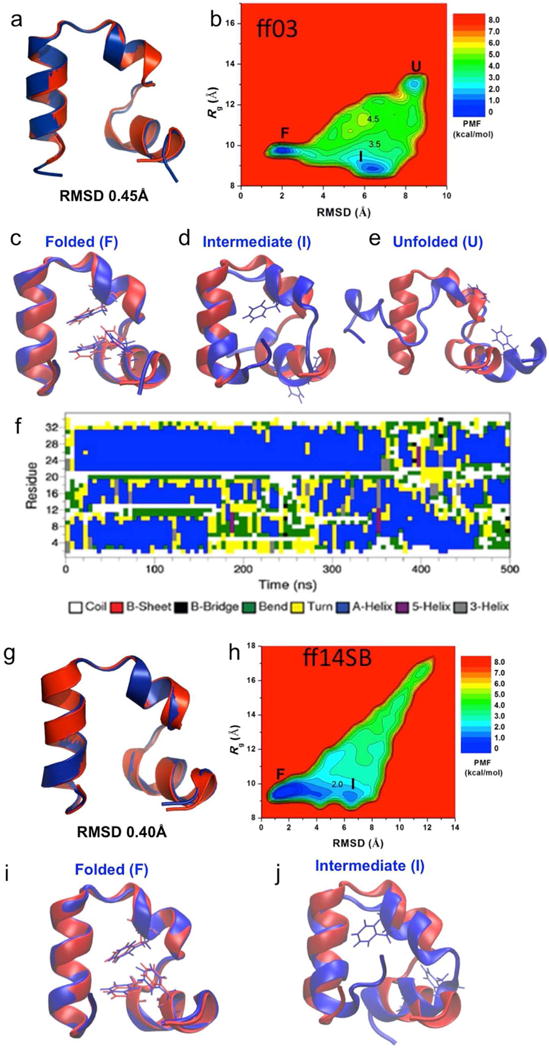
Folding of wild-type villin simulated via aMD: (a) comparison of simulation-folded villin using ff03 force field (blue) with the PDB (1YRF) native structure (red) that exhibits 0.45 Å RMSD at t=250 ns, (b) two-dimensional (RMSD, Rg) free energy profiles calculated by reweighting the nine 500 ns aMD simulations combined using ff03 force field, (c) folded (“F”), (d) intermediate (“I”), and (e) unfolded (“U”) states (blue) aligned to the native structure (red), (f) time evolution of the protein secondary structure during the 500 ns aMD simulation containing the folded structure shown in (a), (g) comparison of simulation-folded villin using ff14SB force field (blue) with the PDB (1YRF) native structure (red) that exhibits 0.40 Å RMSD at t = 500 ns, (h) two-dimensional (RMSD, Rg) free energy profiles calculated by reweighting the three 1500 ns aMD simulations combined using ff14SB force field, (i) folded (“F”), and (j) intermediate (“I”) states (blue) aligned to the native structure (red).