Figure 5.

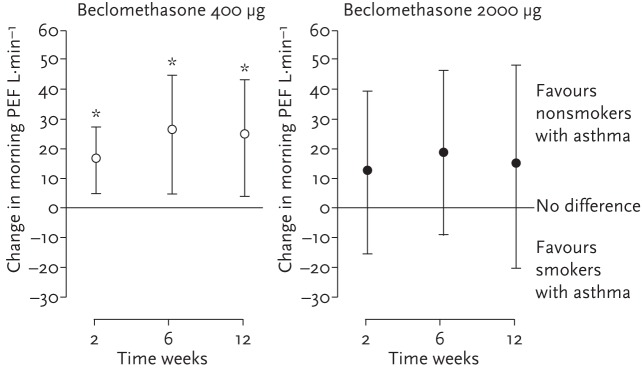
Mean (95% CI) difference between non-smokers and smokers with asthma, Suggesting alternatives to higher-dose ICS may be required. *: p≤0.01 for smokers versus non-smokers. Reproduced from [36] with permission from the publisher.

Mean (95% CI) difference between non-smokers and smokers with asthma, Suggesting alternatives to higher-dose ICS may be required. *: p≤0.01 for smokers versus non-smokers. Reproduced from [36] with permission from the publisher.