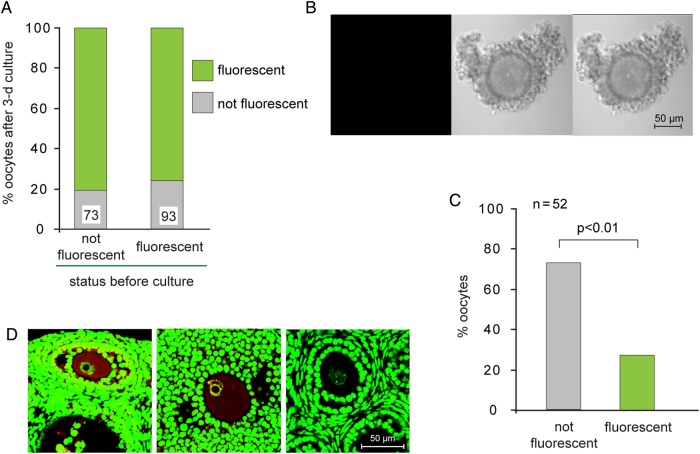
Figure 2.
Gain and loss of fluorescence during oocyte growth. (A) Granulosa cell–oocyte complexes (GOCs) containing growing oocytes were collected and stained using FDG. GOCs containing fluorescent and non-fluorescent oocytes were then incubated separately for 3 days and stained again to determine whether the oocyte was fluorescent. Data are summed from three experiments. The number of oocytes examined is shown at the base of each bar. (B) No fluorescence is detectable in fully grown oocytes. (C) Percentage of fluorescent and non-fluorescent fully grown oocytes. Data are summed from three experiments. Chi-square test. (D) Ovarian sections were stained using anti-β-galactosidase (red) and YOYO-1 (green). Left: Prominent β-galactosidase staining in growing oocyte of transgenic female. Middle: Extremely weak staining in fully grown oocyte of transgenic female. Right: Undetectable staining in growing oocyte of wild-type female. Note NSN chromatin configuration in left and right oocytes; SN configuration in middle oocyte.

