
Fig. 11.
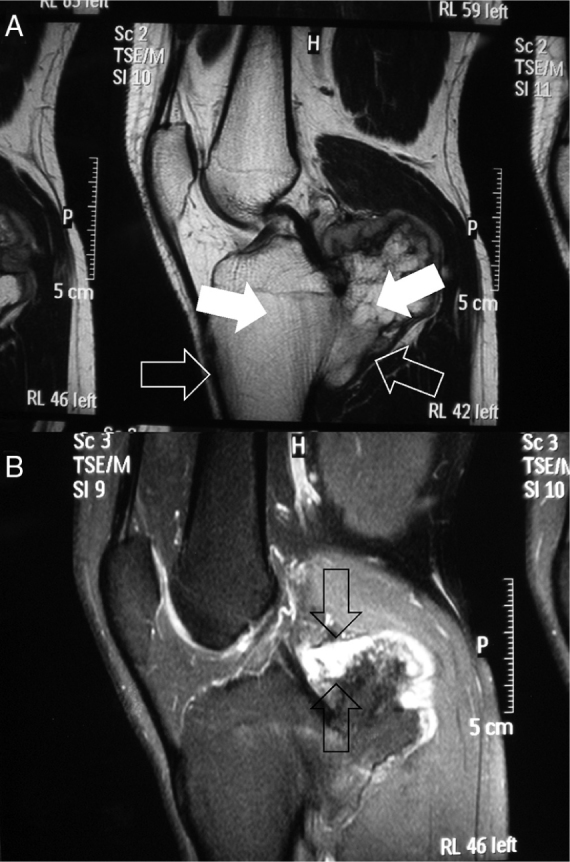
Magnetic resonance images. (A) T1-weighted sagittal image (note hyposignal of the cortical bone and the lesion [open arrows] and hypersignal of the bone medulla in both [filled arrows]). (B) T2-weighted sagittal image (note that the greatest thickness of the cartilaginous cover was around 1.5 cm [between arrows]).