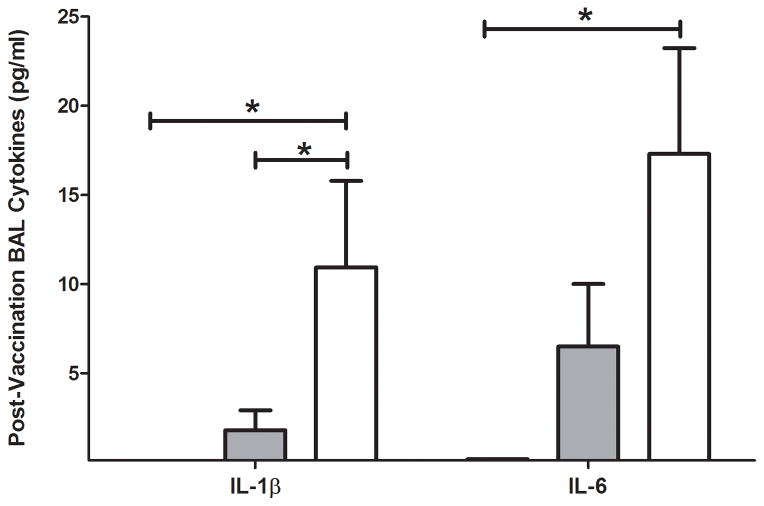
Figure 4.
BAL fluid cytokines measured in response to vaccination. No cytokines were detected above the MDL before vaccination (IL-1β: C57Bl/6 < 0.20 pg/ml, hemizygous = 1.8 pg/ml (SEM, 1.1), SCD = 11 pg/ml (SEM, 4.9); p<0.05) (IL-6: C57Bl/6 < 0.28 pg/ml, hemizygous = 6.5 pg/ml (SEM, 3.5), SCD = 17 pg/l (SEM, 5.9); p<0.05). Bars represent mean levels +/− standard error of the mean. Significant differences were determined by one-way analysis of variance and pairwise comparisons were conducted utilizing the Dunnett’s post-hoc test with SCD serving as the control group. Black bars = C57Bl/6; grey bars = hemizygous; white bars = SCD. *p<0.05

