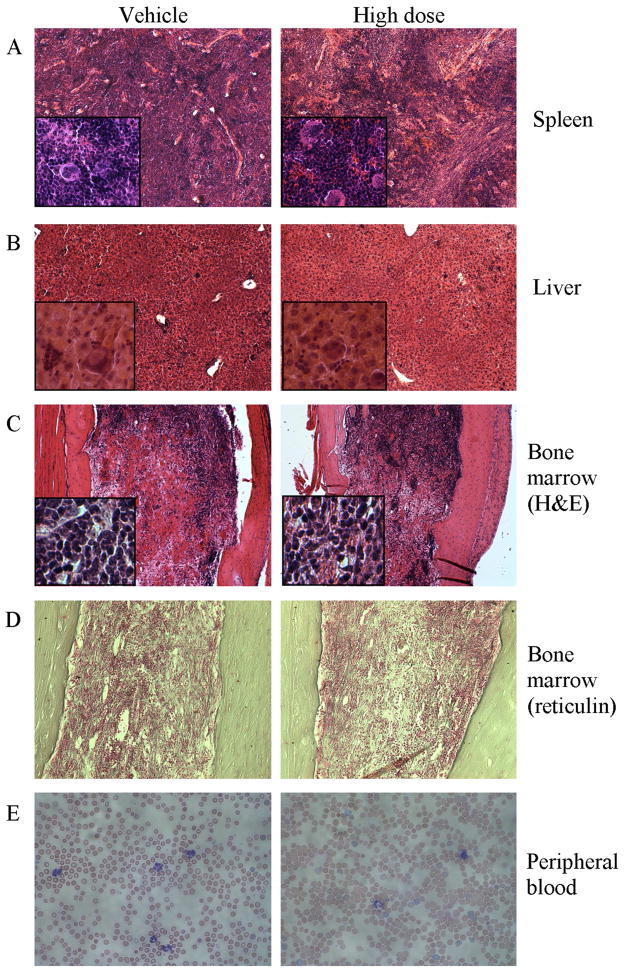
Figure 3. Histopathology after 42 days of treatment with BMS-911543.
Representative histological sections are shown for (A) spleen, (B) liver, (C) bone marrow stained with H&E, (D) bone marrow stained with Chandler’s reticulin stain, each at Day 42, and (E) peripheral blood (Wright’s stain) at Day 35. A–C are 10x with 40x insets, D is 20x, and E is 40x.

