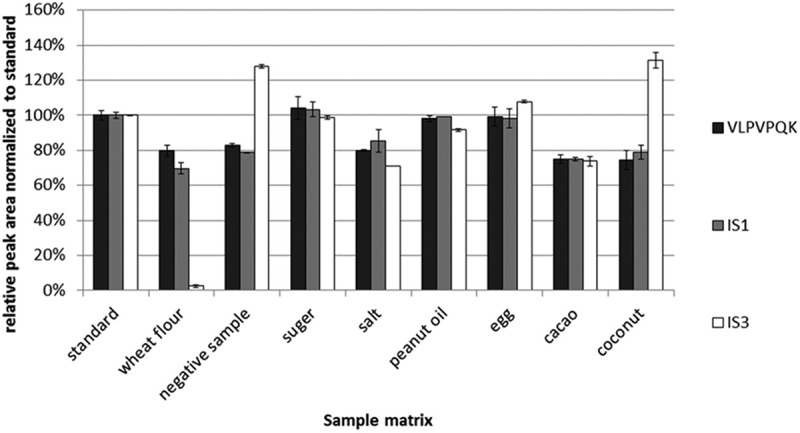
Figure 2.

Comparison of the relative peak areas normalised to a standard of IS1, IS3 and a signature peptide in different food matrices (n = 3). A total of 10 µg ml–1 bovine β-casein solution and 1:100 diluted human milk were digested respectively and combined with 0.25 µg ml–1 IS1 solution at the ratio of 1:1:1 (v/v/v) to form a digest mixture. The negative sample and commonly used baking ingredients (wheat flour, sugar, salt, peanut oil, hen’s eggs, cacao and coconut) were treated identical with human and bovine β-casein with trypsin, and mixed in a ratio of 1:1 (v/v) with the digest mixture. The standard solution was prepared by mixing the digest mixture and water in the ratio of 1:1 (v/v), and its peak area was set as 100% abundance.
