
Figure 4.
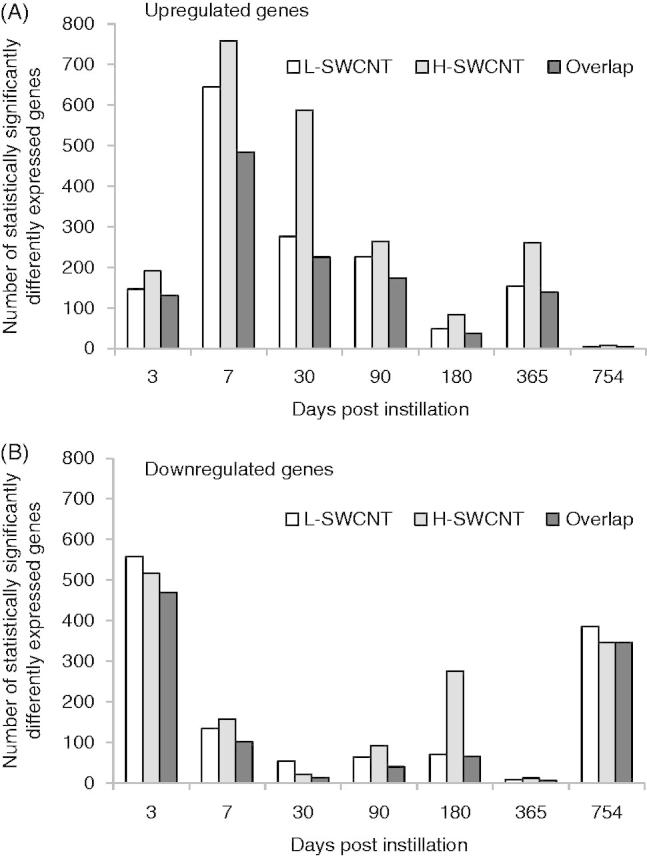
Genes with statistically significant upregulated/downregulated changes in expression at each time point in the L-SWCNT group and H-SWCNT group. Upregulated genes (A) or downregulated genes (B) with p values less than or equal to 0.05 at each time point, including overlaps between the L-SWCNT group and H-SWCNT group, were counted.