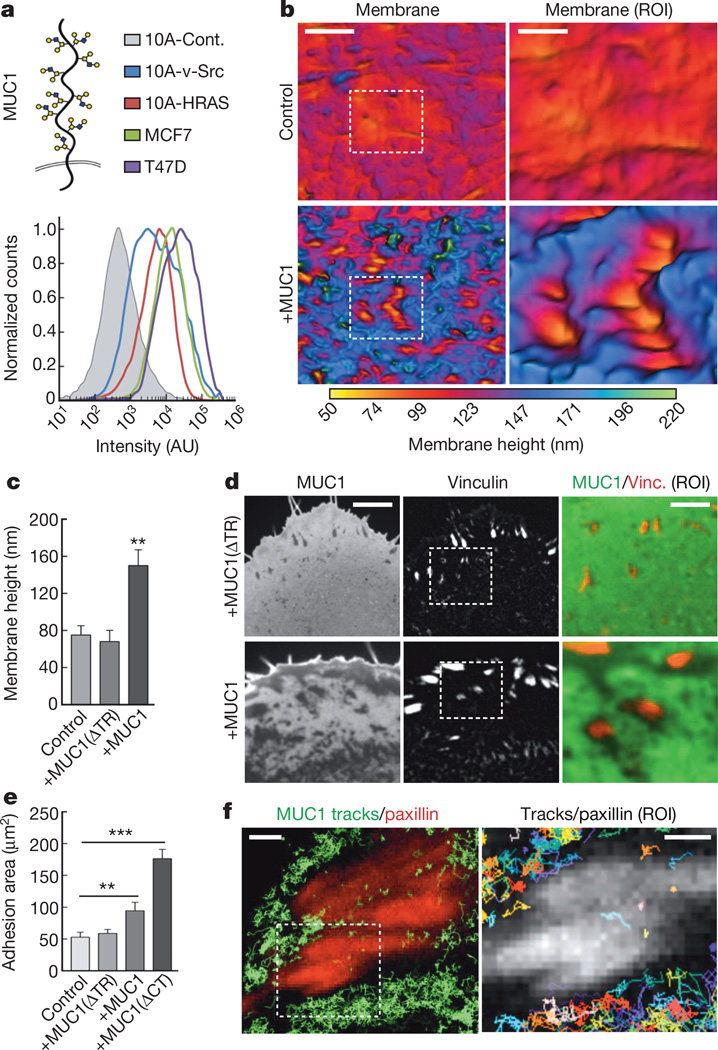
Figure 2. The bulky cancer-associated glycoprotein MUC1 drives integrin clustering.
a, Cartoon of MUC1 and quantification of MUC1 cell-surface levels on control (10A-Cont.), transformed (10A-v-Src, 10A-HRAS) and tumour (MCF7, T47D) cells. b, Topographical SAIM images of representative mCherry–CAAX-labelled ventral plasma membranes in control and MUC1–GFP-expressing (+MUC1) MECs (Scale bar, 5 µm; region of interest (ROI) scale bar, 2 µm). c, Quantification of mean plasma membrane height in control MECs and those ectopically expressing ectodomain-truncated MUC1–GFP (+MUC1(ΔTR)) and wild-type MUC1–GFP (+MUC1). Results are the mean ± s.e.m. of at least 15 cell measurements in duplicate experiments. d, Fluorescence micrographs of MUC1 (ΔTR) or wild-type MUC1 expressed in MECs and their focal adhesions labelled with vinculin–mCherry (scale bar, 3 µm; ROI scale bar, 1.5 µm). e, Quantification of the total adhesion complex area per cell in control non-malignant MECs (control) and those ectopically expressing MUC1 (ΔTR), wild-type MUC1, or cytoplasmic-tail-deleted MUC1 (+MUC1(ΔCT)). Results are the mean ± s.e.m. of three separate experiments. f, Left panel: trajectories of individual mEOS2-tagged MUC1 proteins recorded at 50 Hz using sptPALM (green) and focal adhesions visualized with paxillin–GFP (red) in MEFs (scale bar, 3 µm). Right panel: the ROI from the left panel with individual MUC1 tracks displayed in multiple colours (scale bar, 1 µm). Statistical significance is given by *P < 0.05; **P < 0.01; ***P < 0.001.

