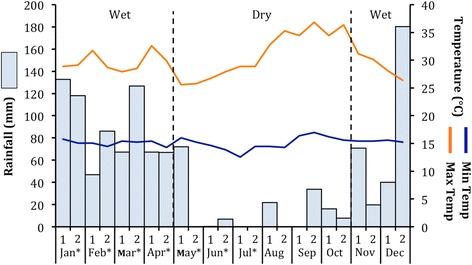
Figure 1.

Issa climate. Minimum and maximum average bi-monthly temperatures and rainfall at Issa during 2012. The study period is depicted by months with an *. Months belonging to the dry season are those with <100 mm of rainfall and are highlighted with dashed lines.
