Figure 2.

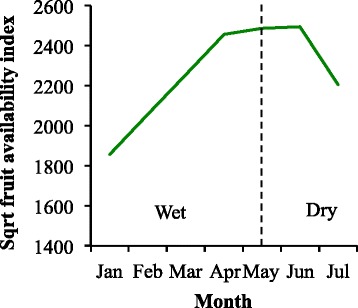
Fruit abundance. Fruit abundance at Issa for duration of study period. The dashed line represents the division between seasons.

Fruit abundance. Fruit abundance at Issa for duration of study period. The dashed line represents the division between seasons.