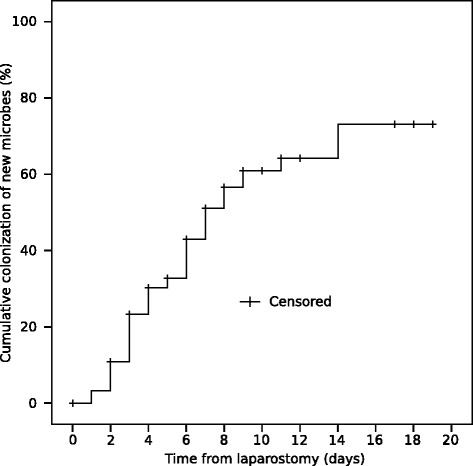
Fig. 2.

A Kaplan-Meyer plot for the cumulative colonization of new microbes during the TAC treatment. The time point of the last and negative microbial sample is marked with a plus sign (=censored)

A Kaplan-Meyer plot for the cumulative colonization of new microbes during the TAC treatment. The time point of the last and negative microbial sample is marked with a plus sign (=censored)